
Boxplot
Loading the math board and drawing, please wait…
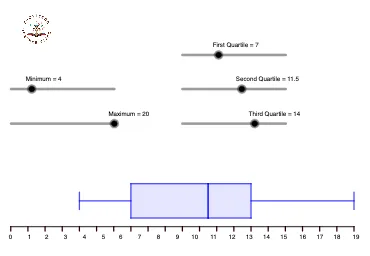
This example demonstrates how to create a boxplot, a statistical chart that shows the distribution of a dataset. It uses GeoGebra commands like Segment, Sequence, and Polygon to illustrate key statistical features such as the median and quartiles. Suitable for students at the middle school level and above.
GeoGebra Commands & Parameters
Segment((0, 0), (20, 0)) → fSequence(Segment[(f, 0), (f, -0.25)], f, 0, 20, 1) → L_1, {0.25, 0.25, 0.25, 0.25, 0.25, 0.25, 0.25, 0.25, 0.25, 0.25, 0.25, 0.25, 0.25, 0.25, 0.25, 0.25, 0.25, 0.25, 0.25, 0.25, 0.25}Polygon(A, B, D, C) → q1, a_1, b_1, d_1, c_1Polygon(D, F, E, C) → q2, d_2, f_1, e_1, c_2Segment(G, H) → gSegment(I, J) → hSegment((a, 1.5), (b, 1.5)) → iSegment((e, 1.5), (d, 1.5)) → j
AI Drawing Prompt Reference
Draw a boxplot with median, first and third quartiles. Start by drawing a horizontal line segment to represent the data range, then use a series of short vertical lines to indicate data point density. Next, draw two rectangular boxes to represent the first and third quartile intervals, with a median line separating them. Finally, draw two vertical line segments to represent the whiskers, indicating the minimum and maximum values of the data range.
The prompt above was compiled from the original drawing commands and is for reference only.