
Boxplot Construction and Demonstration
Loading the math board and drawing, please wait…
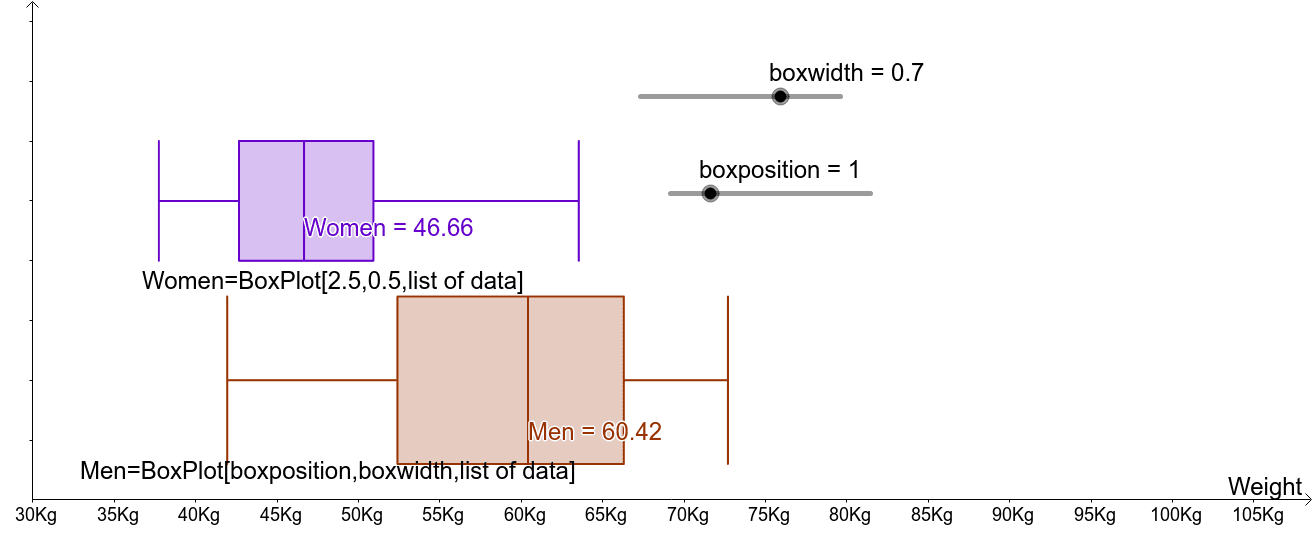
This example demonstrates how to use GeoGebra to create and compare boxplots for two data sets, highlighting statistical concepts like five-number summary, median, quartiles, and outliers. Key GeoGebra commands and objects used include Sequence, Mean, BoxPlot, along with data lists and parameters for customization. Suitable for high school statistics and probability education, ideal for classroom demonstrations or student explorations.
GeoGebra Commands & Parameters
Sequence(RandomNormal[54, 10], n, 1, 12) → menSequence(RandomNormal[50, 10], n, 1, 12) → womenMean(men) → bMean(women) → cSequence((Element[men, n], 1), n, 1, Length[men]) → list1Sequence((Element[women, n], 2.5), n, 1, Length[women]) → list2BoxPlot(boxposition, boxwidth, men) → MenBoxPlot(2.5, 0.5, women) → Women