
Box Plot
Loading the math board and drawing, please wait…
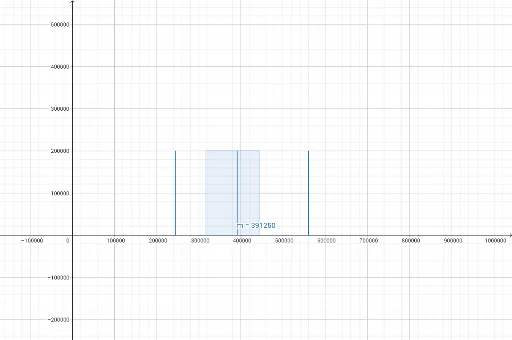
This example demonstrates how to create a box plot. A box plot is a statistical chart that shows the distribution of a dataset. It involves key mathematical concepts such as the median, quartiles, and outliers. Using the GeoGebra command BoxPlot, it is easy to generate a box plot. Suitable for middle school and above students and teachers for statistics education and data analysis.
GeoGebra Commands & Parameters
BoxPlot(100000, 100000, 245000, 317000, 391250, 443000, 560000) → m