
Box Plot Example
Loading the math board and drawing, please wait…
In collections
AS Statistics
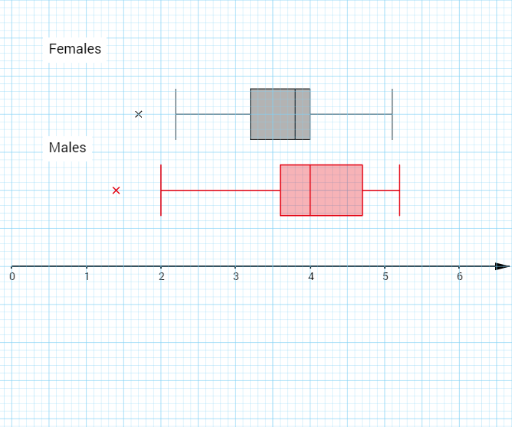
This example demonstrates how to create a box plot, showing the distribution of data. Key mathematical concepts include quartiles, median, and outliers in statistics. Using GeoGebra commands such as RotateText, Sequence, and BoxPlot, the construction and adjustment of the box plot are made easy. Suitable for middle school and above students to learn data statistics and analysis.
GeoGebra Commands & Parameters
RotateText("y", 0) → text3RotateText("x", 0) → text4Sequence(Segment[(-100, i), (100, i)], i, -50, 50, 0.1) → list1Sequence(Segment[(-100, i), (100, i)], i, -50, 50, 0.5) → list2Sequence(Segment[(i, -100), (i, 100)], i, -50, 50, 0.1) → list3Sequence(Segment[(i, -100), (i, 100)], i, -50, 50, 0.5) → list4BoxPlot(1, 0.3333333333333333, {B2, B3, B4, B5, B6, B7, B8, B9, B10, B11, B12, B13, B14, B15, B16, B17, B18, B19, B20, B21, B22, B23, B24, B25, B26, B27, B28, B29, B30, B31}, true) → aText(" Males ", (0.45, 1.5)) → text1Text(" Females ", (0.45, 2.8)) → text2BoxPlot(2, 0.33333, {A2, A3, A4, A5, A6, A7, A8, A9, A10, A11, A12, A13, A14, A15, A16, A17, A18, A19, A20, A21, A22, A23, A24, A25, A26, A27, A28, A29, A30, A31}, true) → b
AI Drawing Prompt Reference
Create a box plot example to show data distribution, including median, quartiles, and outliers. Use light grid lines for the background and add 'Males' and 'Females' text labels at the top. The box plots should clearly display statistical features of two data sets, with a clean layout suitable for statistics education.
The prompt above was compiled from the original drawing commands and is for reference only.