
Box Plot - Check Your Understanding
Loading the math board and drawing, please wait…
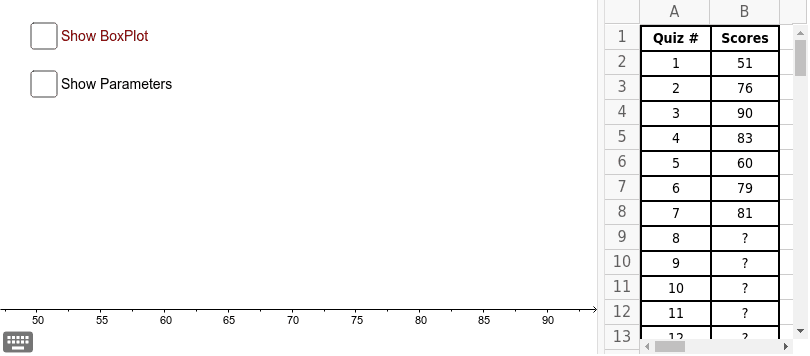
This GeoGebra applet is designed for students to check their understanding of a box and whisker plot (box plot). Users can change the data in the 'Scores' column and observe the generated box plot to verify their understanding. Key mathematical concepts include quartiles and the median. GeoGebra commands such as RemoveUndefined, BoxPlot, Min, Max, Q1, Q3 are used to construct the box plot. Suitable for middle school and above students for self-checking and learning.
GeoGebra Commands & Parameters
RemoveUndefined(B2:B21) → ScoresBoxPlot(1, 1, Scores) → medMin(Scores) → mnMax(Scores) → mxQ1(Scores) → q1Q3(Scores) → q3
AI Drawing Prompt Reference
Create a box plot to display data distribution, including the minimum, maximum, first quartile, and third quartile, with the median marked. The data comes from a list named 'Scores', which users can modify to observe changes in the box plot. The box plot should be constructed based on the minimum, maximum, first quartile, and third quartile values, with the median positioned inside the box.
The prompt above was compiled from the original drawing commands and is for reference only.