
Box-and-Whisker Plot Generator
Loading the math board and drawing, please wait…
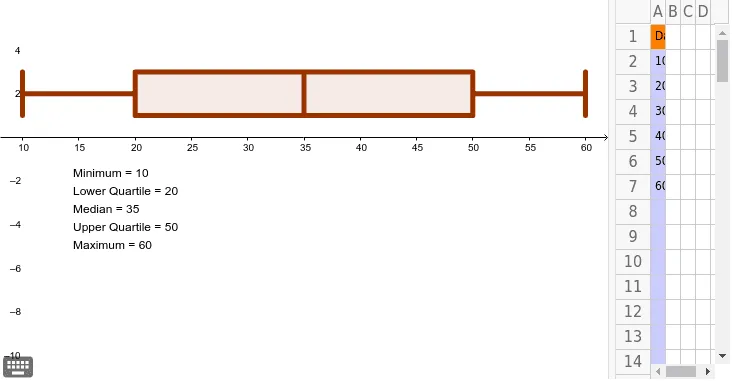
This example demonstrates how to generate a box-and-whisker plot, a statistical chart used to display data distribution. Key mathematical concepts include quartiles and the median. Using GeoGebra commands such as BoxPlot, Min, Max, Q1, Q3, and Median, you can easily create a box-and-whisker plot. Suitable for middle school and above students to learn data statistics and analysis.
GeoGebra Commands & Parameters
RemoveUndefined(Sequence[Cell[1, i], i, 2, 30]) → dataBoxPlot(2, 1, data) → BMin(data) → MNMax(data) → MXQ1(data) → LQQ3(data) → UQMedian(data) → MD