
Box-and-Whisker Plot Generator by pirsquared
Loading the math board and drawing, please wait…
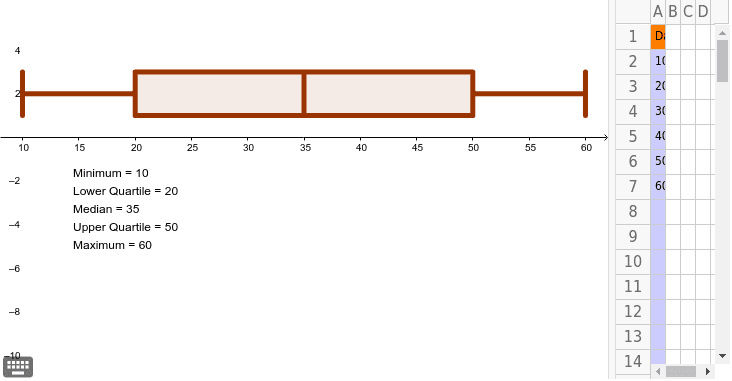
This example demonstrates how to generate a box-and-whisker plot for up to 29 data points. It involves core math concepts from probability & statistics including the box plot, minimum, maximum, first quartile, third quartile, and median. The construction uses GeoGebra commands/objects like RemoveUndefined, BoxPlot, Min, Max, Q1, Q3, Median. Suitable for high school and above mathematics teaching or introductory data analysis learning.
GeoGebra Commands & Parameters
RemoveUndefined(Sequence[Cell[1, i], i, 2, 30]) → dataBoxPlot(2, 1, data) → BMin(data) → MNMax(data) → MXQ1(data) → LQQ3(data) → UQMedian(data) → MD
AI Drawing Prompt Reference
Create a box-and-whisker plot to display the distribution of up to 29 data points, highlighting the minimum, maximum, first quartile, third quartile, and median values derived from analyzing the data sequence. The plot should clearly illustrate the spread and central tendency of the data using these statistical measures.
The prompt above was compiled from the original drawing commands and is for reference only.