
Box and Whisker Diagram + Histogram
Loading the math board and drawing, please wait…
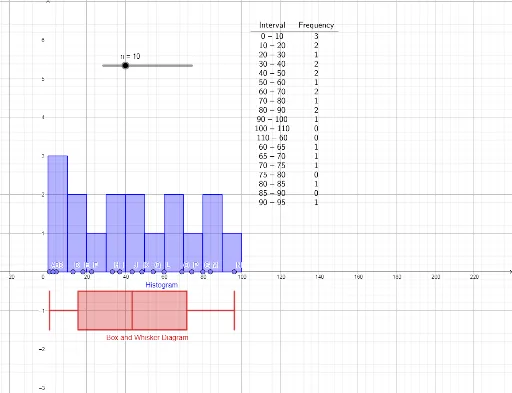
This GeoGebra example combines a box-and-whisker plot with a histogram to display the same dataset, allowing learners to compare distribution shape and summary statistics side by side. Core mathematical concepts include frequency distribution, quartiles, median, range, and outlier detection. Construction uses the Histogram command for the frequency bars, BoxPlot for the five-number summary visualization, and FrequencyTable to generate the underlying frequency data. Objects include data points A through Q, statistical variables n, auxiliary points A1 to A17, and a text label. Suitable for middle or high school statistics lessons, this interactive tool helps students understand how different graphical representations reveal central tendency, spread, and skewness of data.
GeoGebra Commands & Parameters
Point(xAxis) → APoint(xAxis) → JPoint(xAxis) → IPoint(xAxis) → HPoint(xAxis) → GPoint(xAxis) → FPoint(xAxis) → EPoint(xAxis) → DPoint(xAxis) → CPoint(xAxis) → BPoint(xAxis) → KPoint(xAxis) → LPoint(xAxis) → MPoint(xAxis) → NPoint(xAxis) → OPoint(xAxis) → PPoint(xAxis) → QHistogram(false, Classes[{A1, A2, A3, A4, A5, A6, A7, A8, A9, A10, A11, A12, A13, A14, A15, A16, A17}, 0, n], {A1, A2, A3, A4, A5, A6, A7, A8, A9, A10, A11, A12, A13, A14, A15, A16, A17}, true, -1) → aBoxPlot(-1, 0.5, {A1, A2, A3, A4, A5, A6, A7, A8, A9, A10, A11, A12, A13, A14, A15, A16, A17}, true) → bFrequencyTable(a) → text1
AI Drawing Prompt Reference
Create a combined statistical chart that integrates a box-and-whisker plot with a histogram to visualize the same dataset. The chart should include a series of data points plotted along the x-axis, representing observations. Start by generating these data points, then construct a histogram based on them to show frequency distribution with bars. Next, draw a box plot to summarize the five-number summary, including minimum, first quartile, median, third quartile, and maximum. Finally, include a frequency table providing detailed frequency information. Ensure the histogram and box plot are based on the same dataset to allow comparison of distribution shape, central tendency, and spread.
The prompt above was compiled from the original drawing commands and is for reference only.