
Bivariate Function Graph
Loading the math board and drawing, please wait…
In collections
学习 GeoGebra 经典应用
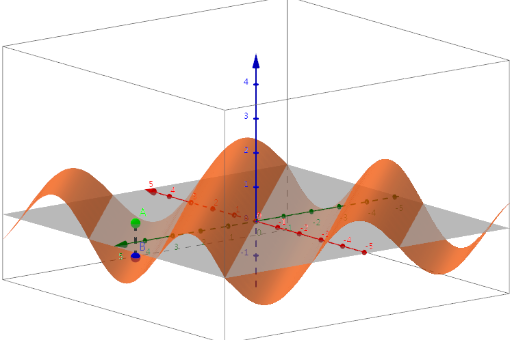
This example demonstrates a bivariate function graph, showcasing the shape and characteristics of the function. Key mathematical concepts include the definition and properties of bivariate functions, and the characteristics of function graphs, such as extreme points and saddle points. Construction points include using GeoGebra's Segment command and objects f, A, a, B. Suitable for educational purposes, particularly in teaching functions and graphs to high school students.
GeoGebra Commands & Parameters
Segment(A, (x(A), y(A), f(x(A), y(A)))) → a
AI Drawing Prompt Reference
Draw a three-dimensional graph of a bivariate function showing its curved surface shape in space. Select a point on the function's surface, then draw a vertical line segment from the point's projection on the xy-plane upward to connect with the corresponding point on the surface, creating a line from the base plane to the function to visually demonstrate how the function value changes with height.
The prompt above was compiled from the original drawing commands and is for reference only.