
Binomial Distribution Probability Histogram (50 students, 0.7 success probabilit
Loading the math board and drawing, please wait…
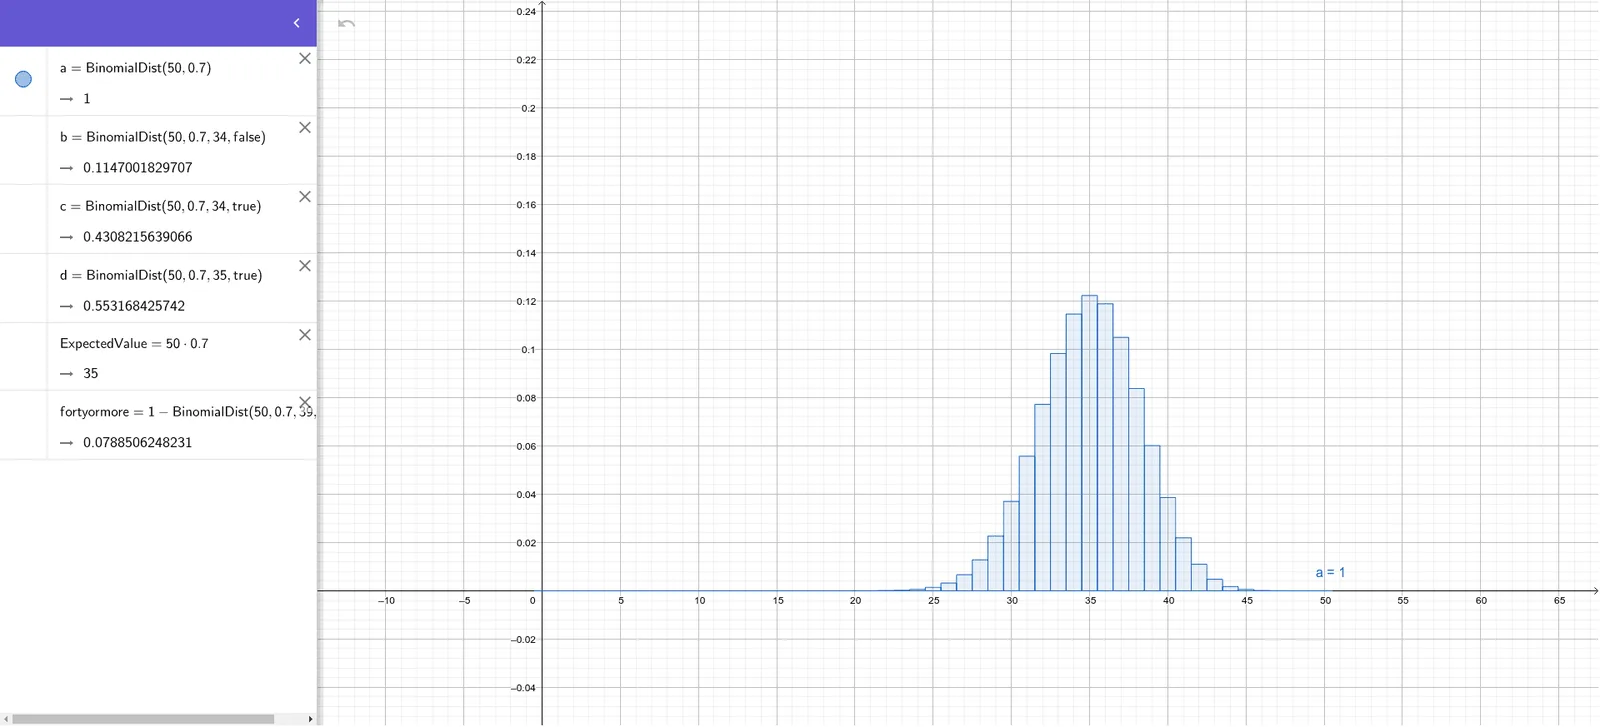
This example demonstrates the probability histogram for a binomial distribution with 50 students and a success probability of 0.7. The core mathematical concepts involved are binomial distribution and probability & statistics. Key construction steps include using the GeoGebra command BinomialDist to generate the distribution, and calculating the expected value and the probability of at least 40 students succeeding. Suitable for high school and above students to learn and understand discrete distributions in probability statistics.
GeoGebra Commands & Parameters
BinomialDist(50, 0.7) → aBinomialDist(50, 0.7, 34, false) → bBinomialDist(50, 0.7, 34, true) → cBinomialDist(50, 0.7, 35, true) → d
AI Drawing Prompt Reference
Create a probability histogram for a binomial distribution with 50 students and a success probability of 0.7, showing the probability distribution for at least 34 and at least 35 students succeeding, and label the expected value and key probability values.
The prompt above was compiled from the original drawing commands and is for reference only.