
Binomial Distribution - Interactive
Loading the math board and drawing, please wait…
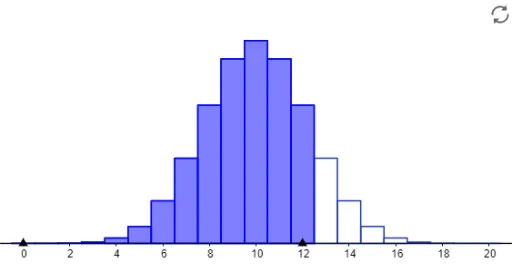
This interactive example demonstrates the graph and properties of the binomial distribution, a discrete probability distribution used to model the number of successes in a fixed number of independent trials. By adjusting parameters, you can observe changes in the shape of the binomial distribution. The example uses the Sequence command in GeoGebra to generate a series of binomial distribution curves. Suitable for high school mathematics and statistics courses.
GeoGebra Commands & Parameters
Sequence(20, 20, 0, 20) →Min(x(Point[xAxis]) + 1.5, x(Point[xAxis]) + 1.5) →Max(x(Point[xAxis]) + 1.5, x(Point[xAxis]) + 1.5) →
AI Drawing Prompt Reference
Create an interactive binomial distribution graph, adjusting parameters to observe changes in the distribution curves. Use 20 independent trials and change the success probability to generate a series of binomial distribution curves.
The prompt above was compiled from the original drawing commands and is for reference only.