
Binomial Distribution Image Generator: Dynamic Tree Diagrams and Bar Charts
Loading the math board and drawing, please wait…
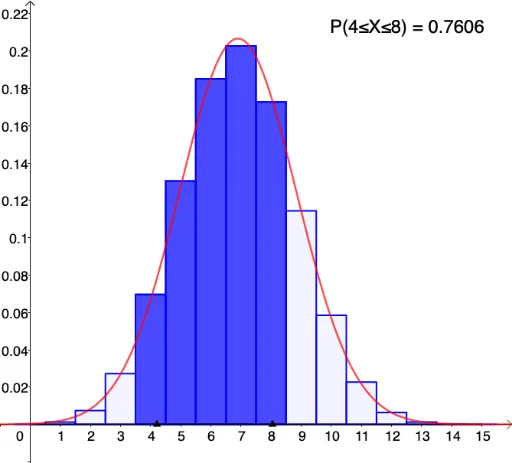
① This example demonstrates how to dynamically generate visual representations of the binomial distribution using GeoGebra, including tree diagrams and bar charts, to illustrate how the probability distribution changes with the number of trials n and success probability p. ② Core mathematical concepts include the binomial distribution, combinations, probability calculations, expected value μ=np, standard deviation σ=√(np(1-p)), and the shape evolution of the distribution as parameters vary. ③ Construction highlights: commands such as SelectedIndex, Sequence, Segment, Point, Sort, Element, Take, and BarChart are used to build tree branches and nodes, while sliders control n and p, updating the mean, standard deviation, and text labels in real time; objects include L_1 to L_7, A, B, C, D, AA, BB, and buttons (button1, button2) for interactive control. ④ Suitable for high school to undergraduate statistics courses, this tool is ideal for classroom demonstrations of the binomial distribution approaching a normal distribution, or as an interactive exploration for students to investigate parameter effects.
GeoGebra Commands & Parameters
SelectedIndex(L_6) → modeSequence(i, i, 0, n) → L_3Segment((0, 0), (n, 0)) → gPoint(g) → BPoint(g) → ASort({A, B}) → L_4Element(L_4, 2) → BBElement(L_4, 1) → AASequence(BinomialDist[n, p, i, false], i, 0, n) → L_5Take(L_5, min + 1.5, max + 1.5) → L_1Take(L_3, min + 1.5, max + 1.5) → L_2BarChart(L_2, L_1, 1) → bBarChart(L_3, L_5, 1) → aElement(texts, mode) → text1
AI Drawing Prompt Reference
Create a dynamic binomial distribution visualization with a probability tree diagram and a corresponding bar chart. The tree branches from a starting point, with the number of branch levels equal to the trial count, and each branch end labeled with its probability. The bar chart has the number of successes on the horizontal axis and probability on the vertical axis, with vertical bars showing the probability height for each count. Include two sliders: one for the number of trials and one for the success probability, with displayed expected value and standard deviation. Additionally, place two draggable points on the horizontal axis to select a range of bars to highlight, while the rest remain dimmed. The layout is clear and suitable for classroom demonstration.
The prompt above was compiled from the original drawing commands and is for reference only.