
Belarus Coronavirus Cases
Loading the math board and drawing, please wait…
In collections
Confirmed Coronavirus Cases in Countries
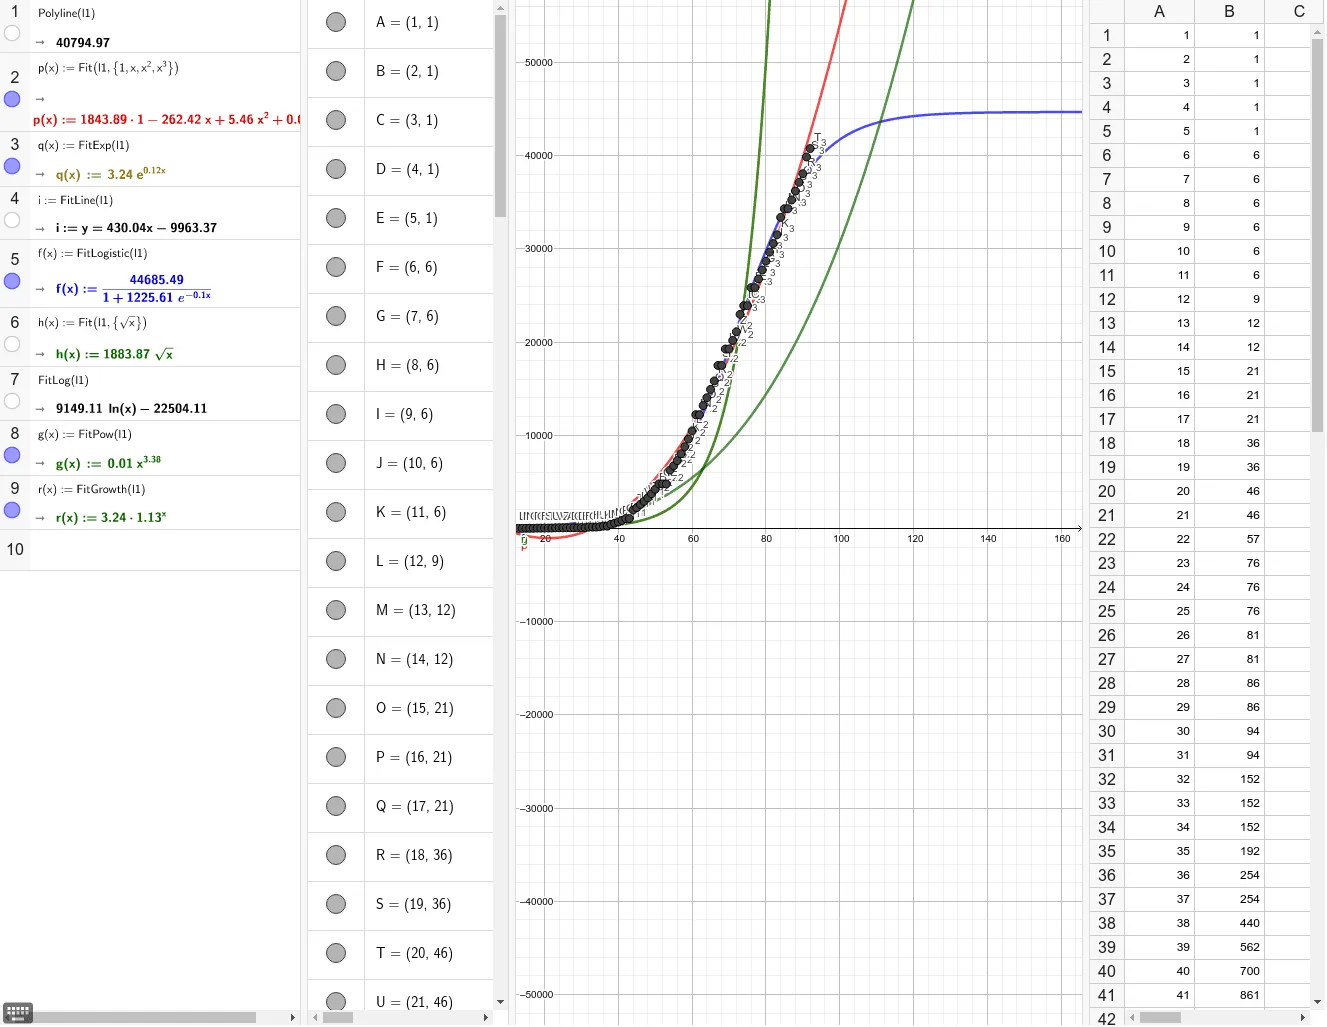
This example demonstrates the distribution of coronavirus cases in Belarus. It involves the concept of geometric distribution in probability statistics. By adjusting parameters, one can observe the trend of case changes over time. This example uses GeoGebra commands such as A1, B1, etc., suitable for high school and above students to learn probability statistics and data analysis.
GeoGebra Commands & Parameters
112131415166768696106116129131214121521162117211836193620462146225723762476257626812781288629863094
AI Drawing Prompt Reference
Create a graph showing the distribution of coronavirus cases in Belarus, with adjustable parameters to observe the trend of case changes over time. The graph should include multiple sequential points connected in a line, demonstrating the geometric distribution concept in probability statistics and clear coordinate geometry relationships.
The prompt above was compiled from the original drawing commands and is for reference only.