
Bayes' Theorem Visualization
Loading the math board and drawing, please wait…
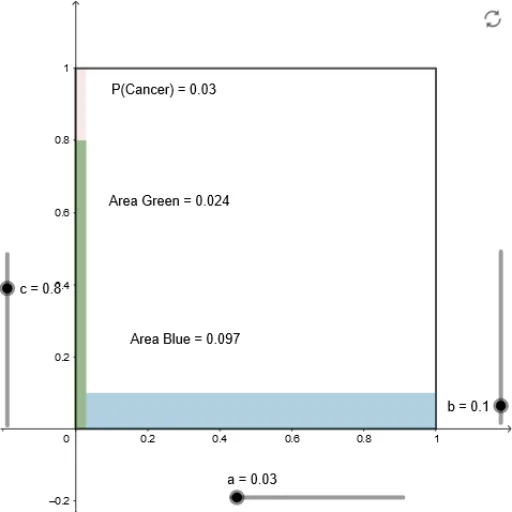
This example visually demonstrates Bayes' Theorem, involving core concepts of probability and statistics. Using GeoGebra commands such as Polygon and PointIn, a dynamic model of Bayes' Theorem is constructed. Suitable for high school and above students or teachers to understand conditional probability and the practical application of Bayes' Theorem.
GeoGebra Commands & Parameters
Polygon((0, 0), (1, 0), 4) → poly1Polygon((0, 0), (a, 0), (a, 1), (0, 1)) → q1, f, g, h, iPolygon((0, 0), (a, 0), (a, c), (0, c)) → q2, j, k, l, mPolygon((a, 0), (1, 0), (1, b), (a, b)) → q3, n, p, q, rPointIn(q2) → Pointq2PointIn(q3) → Pointq3PointIn(q1) → Pointq1