
Bayes' Theorem Calculator
Loading the math board and drawing, please wait…
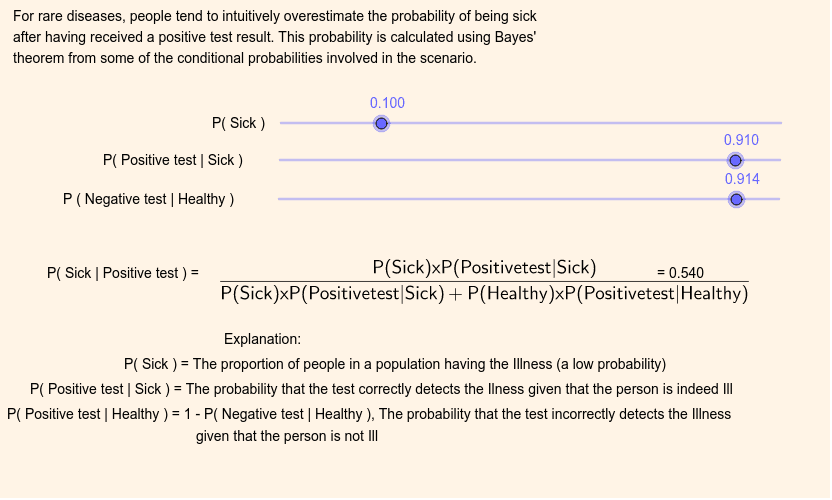
This example demonstrates how to calculate probability according to Bayes' Theorem. The core mathematical concept involved is probability & statistics. Construction highlights include the use of Segment and Text commands in GeoGebra. Suitable for teaching and learning probability & statistics.
GeoGebra Commands & Parameters
Segment(A, B) → dText("P( Sick | Positive test ) = ") → text1Text("= " + ((a * b / ((a * b) + ((1 - a) * (1 - c)))))) → text2
AI Drawing Prompt Reference
Draw a Bayes' Theorem calculator with a square area, including two text labels: “P( Disease | Positive test ) = ” and “= diagnosis probability * test positive rate / (diagnosis probability * test positive rate + (1-diagnosis probability) * (1-test positive rate) )”, and a line segment connecting two points A and B.
The prompt above was compiled from the original drawing commands and is for reference only.