
Basic Tools for Single Variable Statistics
Loading the math board and drawing, please wait…
In collections
ggbchat #4 July 16 2014
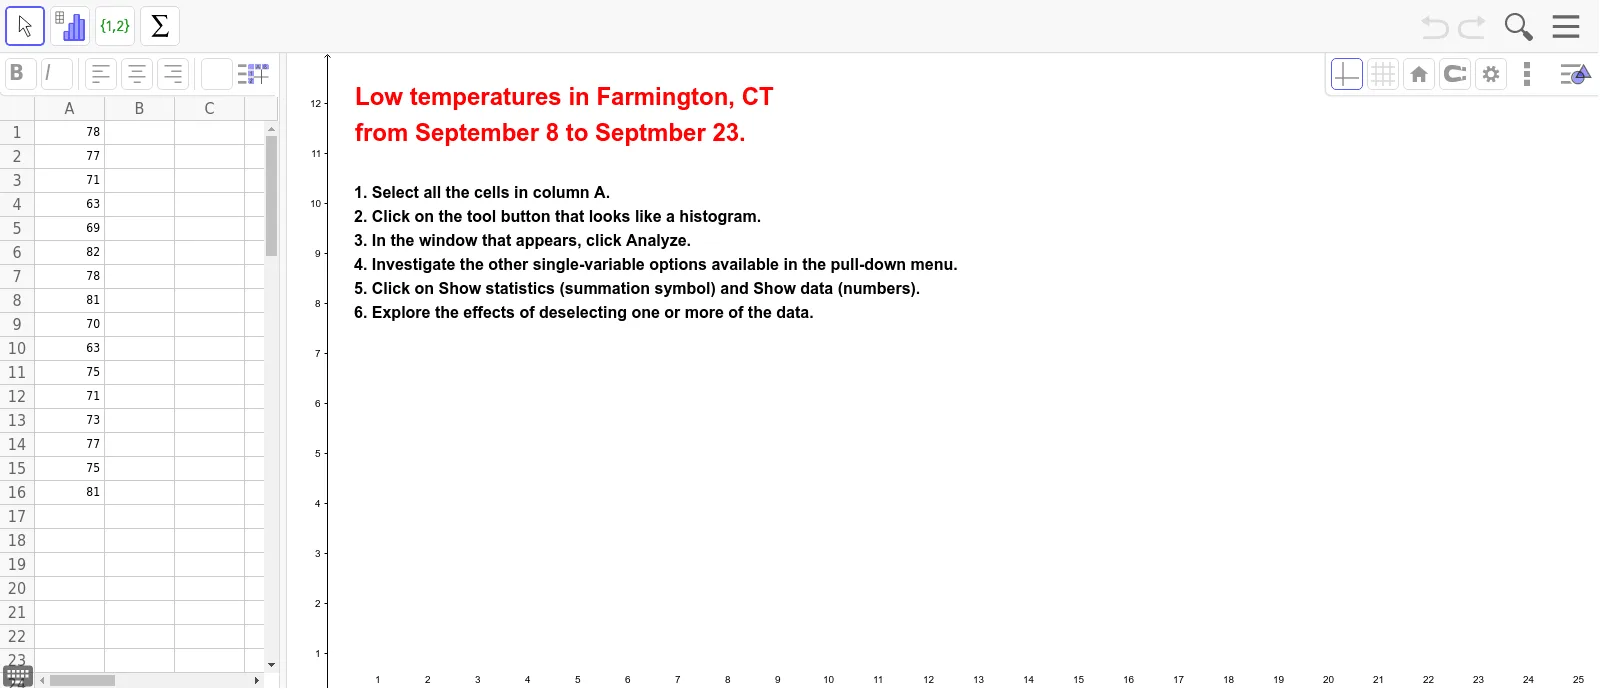
This example demonstrates the basic tools available for single variable statistical studies. It covers fundamental concepts in statistics, such as the median line. Using GeoGebra commands like A1, A2, A3, etc., it visually illustrates the characteristics of data distribution. Suitable for students at the junior high school level and above to learn basic statistical concepts.
GeoGebra Commands & Parameters
Numeric A1(78.0)Numeric A2(77.0)Numeric A3(71.0)Numeric A4(63.0)Numeric A5(69.0)Numeric A6(82.0)Numeric A7(78.0)Numeric A8(81.0)Numeric A9(70.0)Numeric A10(63.0)Numeric A11(75.0)Numeric A12(71.0)Numeric A13(73.0)Numeric A14(77.0)Numeric A15(75.0)Numeric A16(81.0)
AI Drawing Prompt Reference
Create a histogram with 16 data points: 78, 77, 71, 63, 69, 82, 78, 81, 70, 63, 75, 71, 73, 77, 75, 81. Calculate and mark the median line to visually demonstrate the characteristics of the data distribution.
The prompt above was compiled from the original drawing commands and is for reference only.