
Basic Probability (Empirical / Theoretical)
Loading the math board and drawing, please wait…
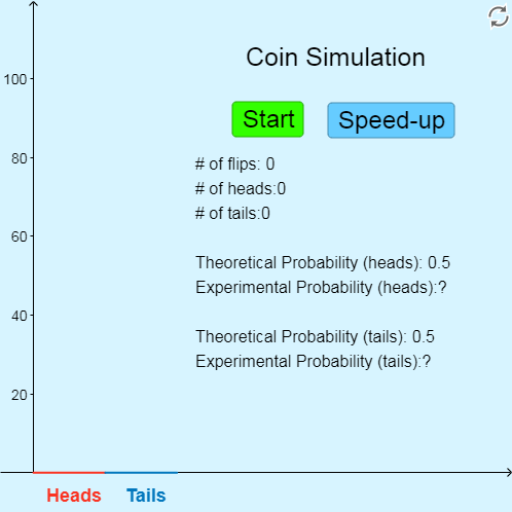
This example demonstrates how to understand probability distribution through experimental data (empirical probability) and theoretical calculation (theoretical probability). Core math concepts include probability, normal distribution, mode, differential calculus, linear equations, and isosceles triangles. It is constructed using GeoGebra commands/objects like Random (random number generation), BarChart (bar chart), Ray (ray), and elements such as f (function), dd (derivative), kk (object), i (loop variable), freq (frequency), start (start), button2 (button), speed (speed), stop (stop), n (number of trials), ymax (maximum value), relfreq (relative frequency), b (object), c (object), szöveg1 (text1), szöveg2 (text2), xmax (maximum value), list (list), text2 (text2), a (object), text1 (text1), text3 (text3). Suitable for high school students learning probability & statistics to visually grasp the relationship between theoretical and empirical probabilities.
GeoGebra Commands & Parameters
Random(0, 1) → ddBarChart(0, 1, relfreq) → bRay((0, 0.5), (5, 0.5)) → cBarChart(0, 1.5, freq) → a