
Empirical Probability Demo
Loading the math board and drawing, please wait…
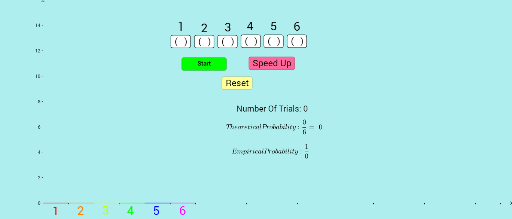
This example demonstrates the statistical process of empirical probability through simulating dice rolls. It involves core math concepts like probability & statistics, focusing on the relationship between frequency and probability. Constructed using GeoGebra commands/objects such as BarChart for frequency distribution, sliders for speed control, and buttons for experiment flow control. Suitable for high school probability & statistics teaching or student exploration.
GeoGebra Commands & Parameters
BarChart(0, 12, FrequencyCount) → DiceFrequencyChart