
Basic Linear Equations Demo
Loading the math board and drawing, please wait…
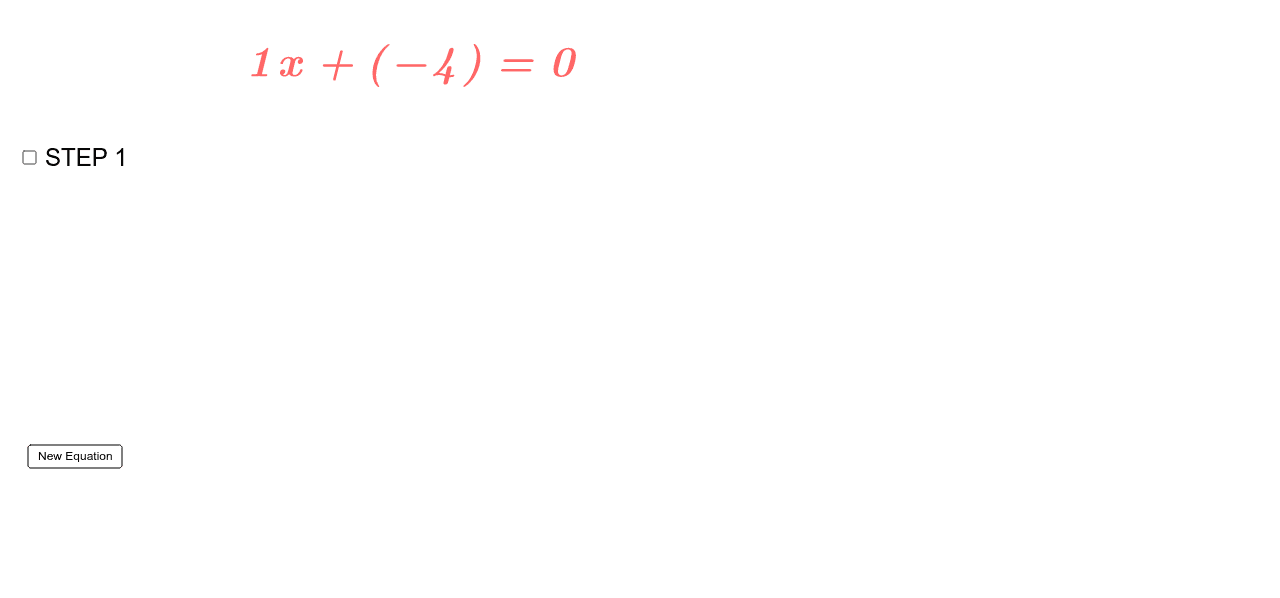
This example demonstrates the graph of linear equations and their variations. Key math concepts include linear equations, slope, y-intercept, and function graphs. It uses GeoGebra commands like Element, Random, FractionText, and objects such as list, sliders, and text elements to illustrate the behavior of linear functions. Suitable for middle school and above students learning about linear functions and equations.
GeoGebra Commands & Parameters
Element(list, Random[1, 8]) → aRandom(-10, 10) → mRandom(-10, 10) → cFractionText(step1 / a) → step4Random(-4, -1) → bRandom(1, 4) → j
AI Drawing Prompt Reference
Create a graph demonstrating linear equations with multiple randomly generated lines, each having different slopes and y-intercepts, and label the slope as a fraction. Include a coordinate grid and axes for reference, suitable for middle school students learning about linear functions and equations.
The prompt above was compiled from the original drawing commands and is for reference only.