
Bar Chart & Polygon Geometry Construction
Loading the math board and drawing, please wait…
In collections
Symmetry, Transformation and Tessellation
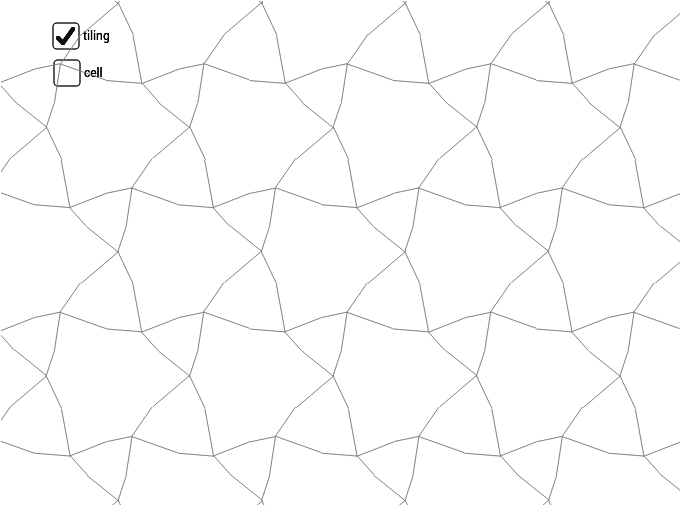
This example demonstrates the construction of bar charts, incircles, and general quadrilaterals using GeoGebra, combined with box plots for statistical data representation. Key math concepts include bar charts, incircles, polygon geometry, box plot statistics, and indefinite integrals. The construction involves commands like Segment, Vector, Rotate, and Sequence, creating various geometric objects and plots. Suitable for high school and above, it aids in geometric construction, data analysis, and introductory calculus education.
GeoGebra Commands & Parameters
Segment(I, L) → qSegment(I, K) → pSegment(J, I) → nSegment(H, I) → mVector(A, B) → uVector(A, C) → vRotate(cell1, 120*°, D) → cell2Rotate(cell1, 240*°, D) → cell3Sequence(Translate[Sequence[Translate[tile, Vector[(n * u)]], n, -3, 3], Vector[(m * v)]], m, -3, 3) → tilingVector(B, G) → wVector(C, G) → dSegment(C, B) → eSegment(C, D) → iSegment(D, B) → jSegment(B, E) → kSegment(E, C) → l
AI Drawing Prompt Reference
Create a geometric illustration featuring bar charts, incircles, and polygons, combined with box plots for statistical data. Start by drawing segments to form a base framework, then use vector rotations and translations to generate a polygonal grid. Add incircles and quadrilaterals, and conclude with box plots to represent statistical data, showcasing geometric construction, data analysis, and introductory calculus concepts.
The prompt above was compiled from the original drawing commands and is for reference only.