
Bar Chart Example
Loading the math board and drawing, please wait…
In collections
Math Year 4 Unit Probability & Statistics
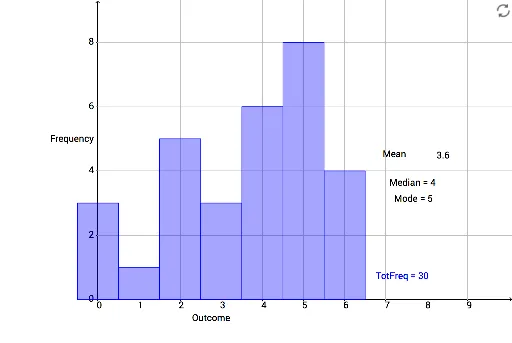
This example demonstrates the construction of a bar chart. Key mathematical concepts include frequency and expected value in probability and statistics. Using GeoGebra commands such as BarChart, Sum, and Text, a bar chart can be constructed. Suitable for middle school and above students to learn how to draw bar charts and understand frequency distribution.
GeoGebra Commands & Parameters
BarChart(Outcome, Freq) → TotFreqSum(Prod) → TotalText(Average) → M