
Bar Chart Construction Example
Loading the math board and drawing, please wait…
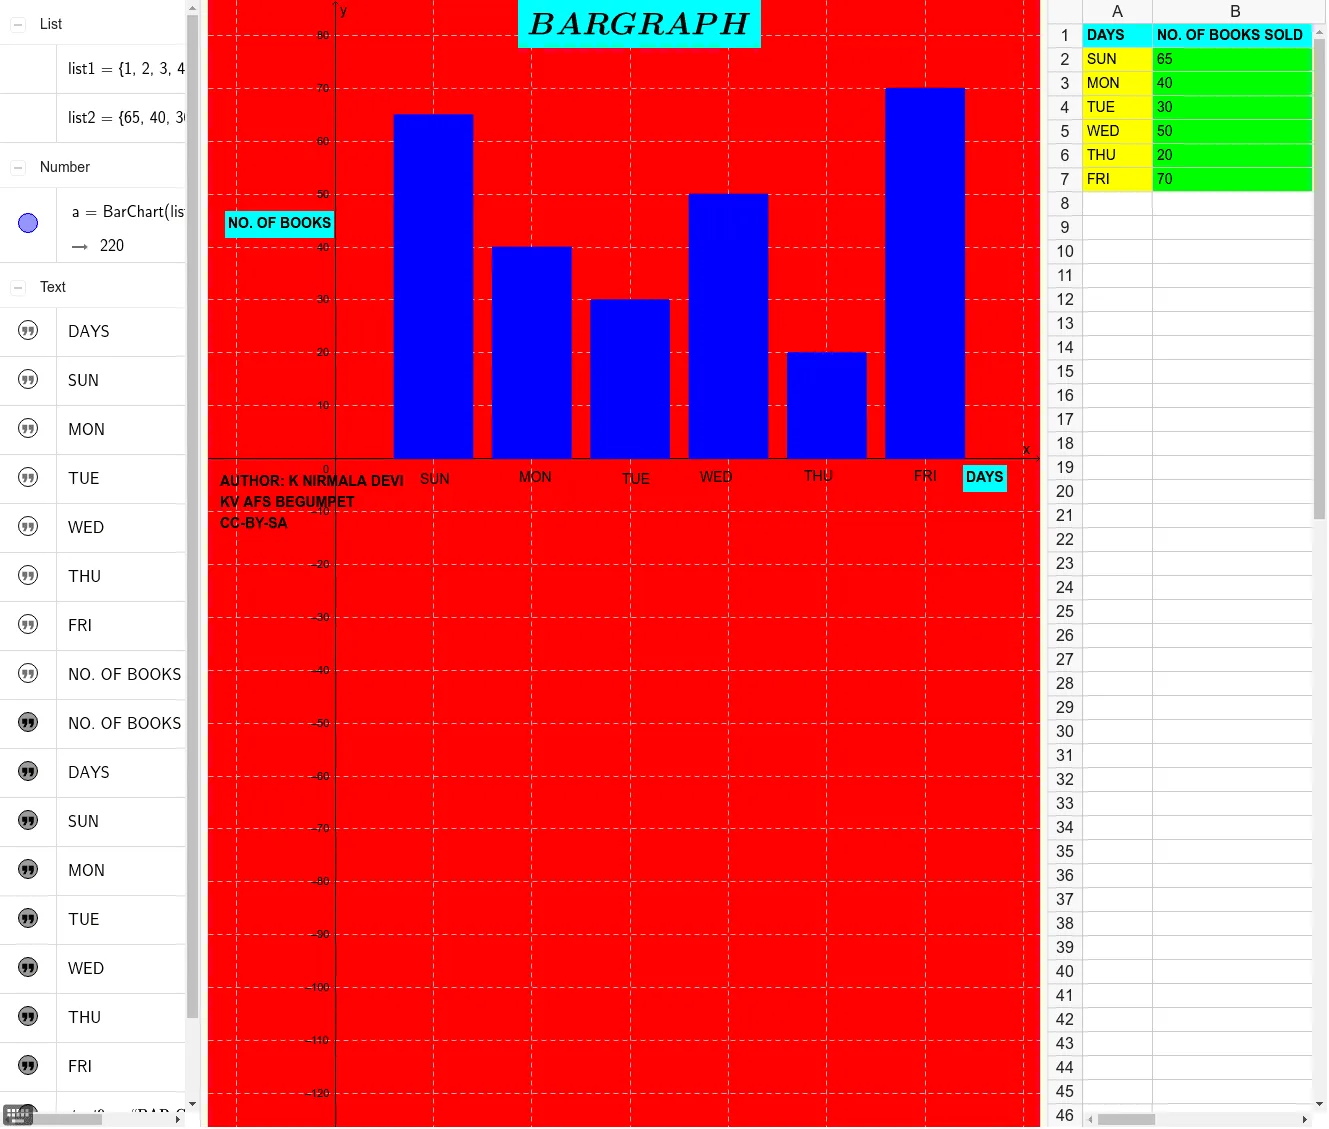
This example demonstrates how to construct a bar chart using GeoGebra, illustrating data distribution. Key math concepts include data visualization, statistical charts, and coordinate geometry. Construction highlights involve the BarChart command, objects like A1, B1, A2-A7, B2-B7, list1, list2, a, and text elements text1-text10. Suitable for middle school students and above learning data statistics and chart plotting, or for educational presentations.
GeoGebra Commands & Parameters
BarChart(list1, list2, 0.8) → a
AI Drawing Prompt Reference
Create a bar chart to illustrate data distribution. First, create two lists: one for categories and another for corresponding data values. Then, use the BarChart command with a width of 0.8 to generate the bar chart. The chart includes 10 text labels to annotate categories and data values.
The prompt above was compiled from the original drawing commands and is for reference only.