
Balloons' Volume Rate of Change
Loading the math board and drawing, please wait…
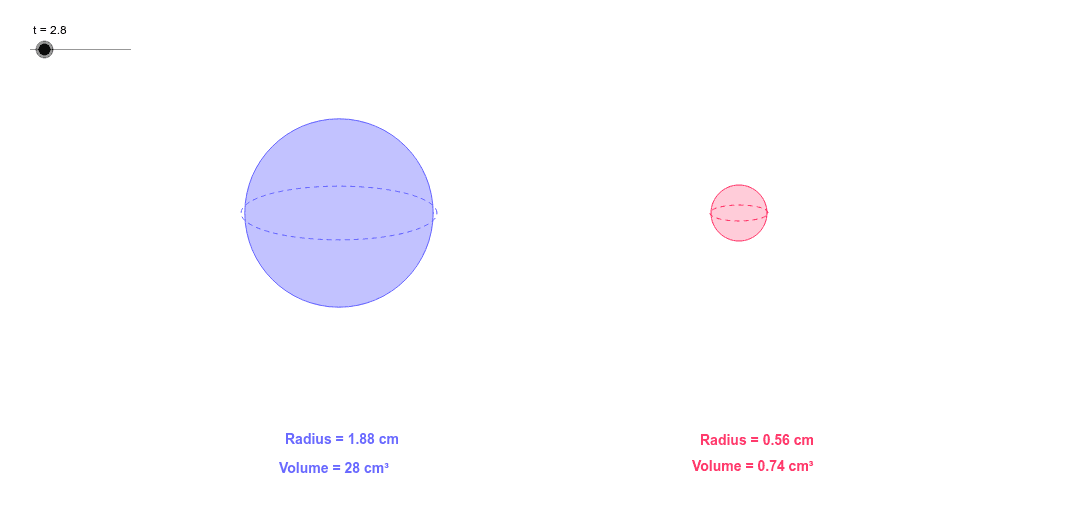
This example demonstrates the relationship between the volumes of two balloons over time. Key mathematical concepts include volume calculation and related rates. Using GeoGebra commands such as Circle and Ellipse, the example dynamically shows how the volume of the balloons changes over time. Suitable for high school and above students studying related rates problems.
GeoGebra Commands & Parameters
Circle(C, R) → cEllipse(R2, R, R3) → dCircle(D, D2) → eEllipse(D2, D3, D4) → f
AI Drawing Prompt Reference
Draw the relationship between the volumes of two balloons over time. Start by drawing a circle to represent the first balloon, then draw an ellipse to represent the second balloon. Next, draw a second circle to show the volume change of the first balloon, and finally, draw another ellipse to show the volume change of the second balloon. Pay attention to the relationship between the ellipses and circles to understand the dynamic process of volume change.
The prompt above was compiled from the original drawing commands and is for reference only.