
Average Rate of Change
Loading the math board and drawing, please wait…
In collections
Fun with Functions
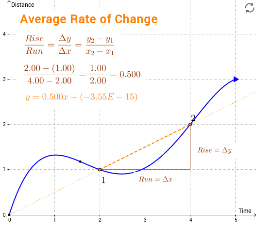
This applet demonstrates the line between two points on a function and calculates its slope to illustrate the average rate of change. Key mathematical concepts include functions, slope, and average rate of change. It uses GeoGebra commands such as Polynomial, Point, Segment, Slope, Polygon, Midpoint, and Line. Suitable for high school mathematics education and learning.
GeoGebra Commands & Parameters
Intersect(xAxis, yAxis) → APolynomial({A, C, D, E, F}) → fPoint(g) → BPoint(g) → GSegment(G, B) → aSlope(a) → mPolygon(G, H, B) → poly1, b, g_1, hMidpoint(b) → IMidpoint(g_1) → JLine(G, B) → c