
Average Rate of Change for Quadratic Functions
Loading the math board and drawing, please wait…
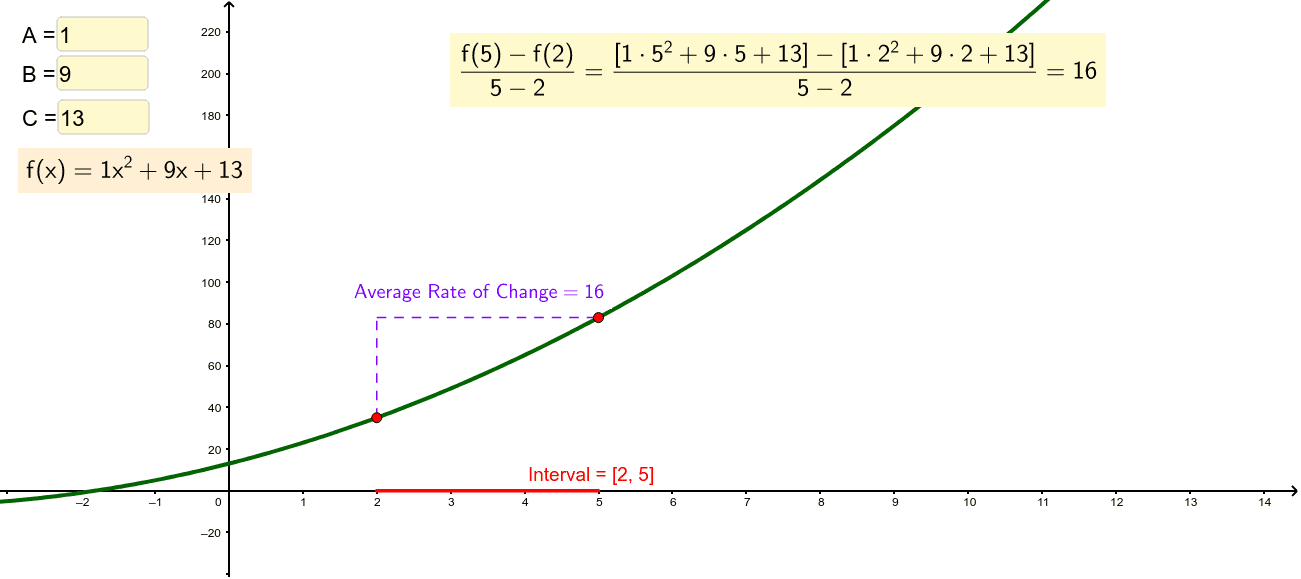
This example demonstrates how to use GeoGebra to graph a quadratic function and calculate the average rate of change between two points. Core math concepts include quadratic functions, average rate of change, and analytical geometry. Construction highlights involve commands like Point, Segment, Textfield, and objects such as A, B, C, f, D, E, a, b, G, H, xD, xE, c, etc., for representing the function graph and computation. Suitable for high school students learning about function rate of change.
GeoGebra Commands & Parameters
Point(f) → DPoint(f) → ESegment(D, (x(D), y(E))) → aSegment((x(D), y(E)), E) → bSegment(G, H) → cTextfield(A) → InputBox1Textfield(B) → InputBox2Textfield(C) → InputBox3