
Asymptotes for Rational Functions: Vertical, Horizontal, and Oblique
Loading the math board and drawing, please wait…
In collections
Graph Transformations
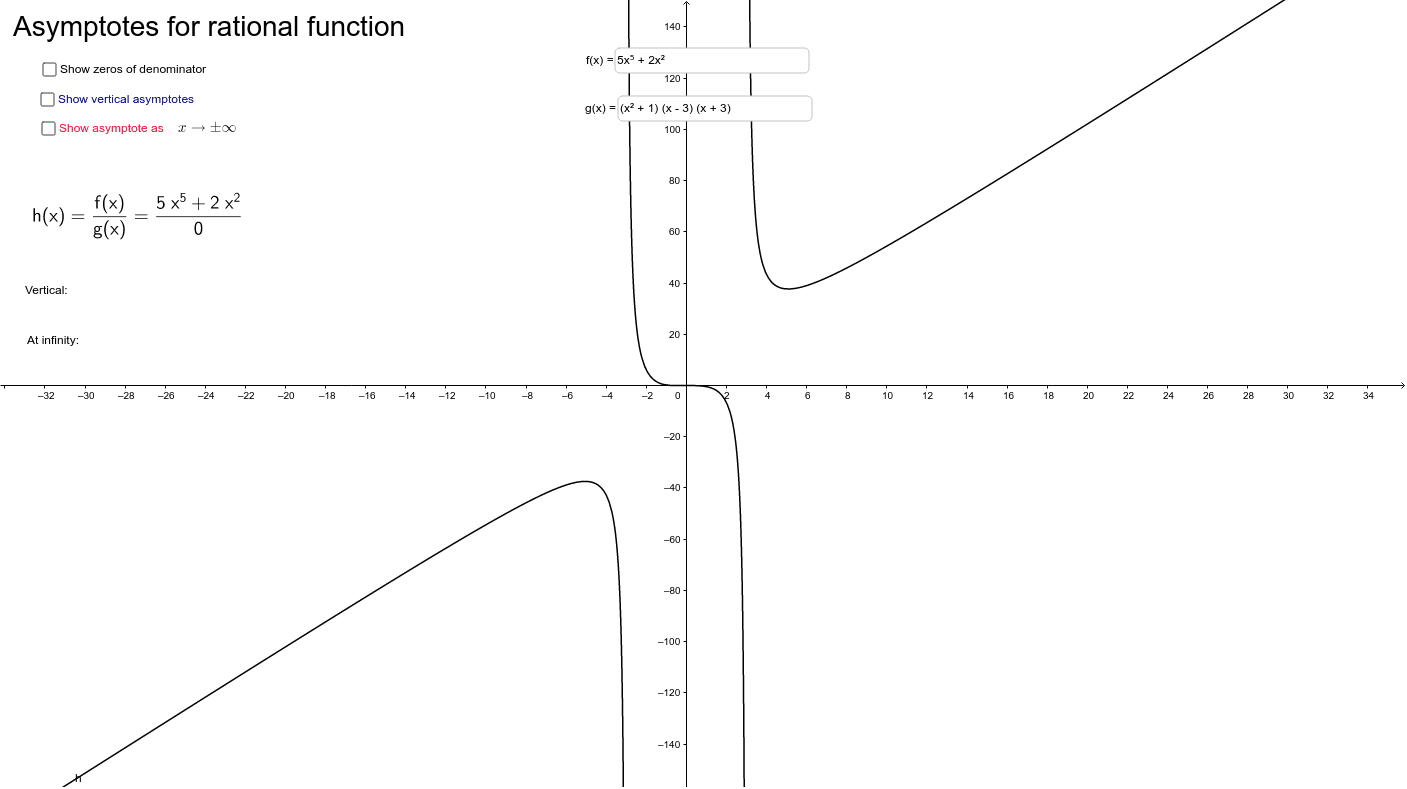
This GeoGebra example dynamically illustrates the vertical, horizontal, and oblique asymptotes of a rational function, showing how the graph approaches these lines as x tends to infinity or near discontinuities. Core mathematical concepts include rational functions, polynomial division, asymptote definitions (vertical asymptotes at denominator zeros; horizontal/oblique asymptotes determined by degree comparison), and limit behavior. Construction highlights: uses the Div command for polynomial division to obtain the quotient (oblique asymptote equation), Coefficients and Degree to extract polynomial data, Derivative for analysis, Point and Line to draw asymptote lines, Textfield and text objects for dynamic equations and explanations, Intersection for key points, and sliders (a, b, c, d) to adjust function parameters and observe changes in real time. Suitable for senior high school or pre-calculus/calculus courses, this tool helps students understand rational function graphs and algebraic methods for finding asymptotes, and serves as an interactive classroom demonstration or self-study resource.
GeoGebra Commands & Parameters
Div(f, g) → hmurCoefficients(g) → kertgDegree(g) → n_gCoefficients(f) → kertfDegree(f) → n_fDerivative(Integral[g]) → ggPoint(xAxis) → ALine(A, B) → aTextfield(f) → tekstikenttä1Textfield(g) → tekstikenttä2Intersection(juuret_f, juuret_g) → juuret_{fg}
AI Drawing Prompt Reference
Create a dynamic illustration showing vertical, horizontal, and oblique asymptotes of a rational function, depicting how the graph approaches these lines. Use polynomial division to find the oblique asymptote equation, extract coefficients and degrees, and analyze derivatives. Draw asymptote lines, label their equations, and mark intersection points with the function. Include sliders to adjust function parameters and observe real-time changes in the graph.
The prompt above was compiled from the original drawing commands and is for reference only.