
Arithmetic Mean of Discrete Data (1)
Loading the math board and drawing, please wait…
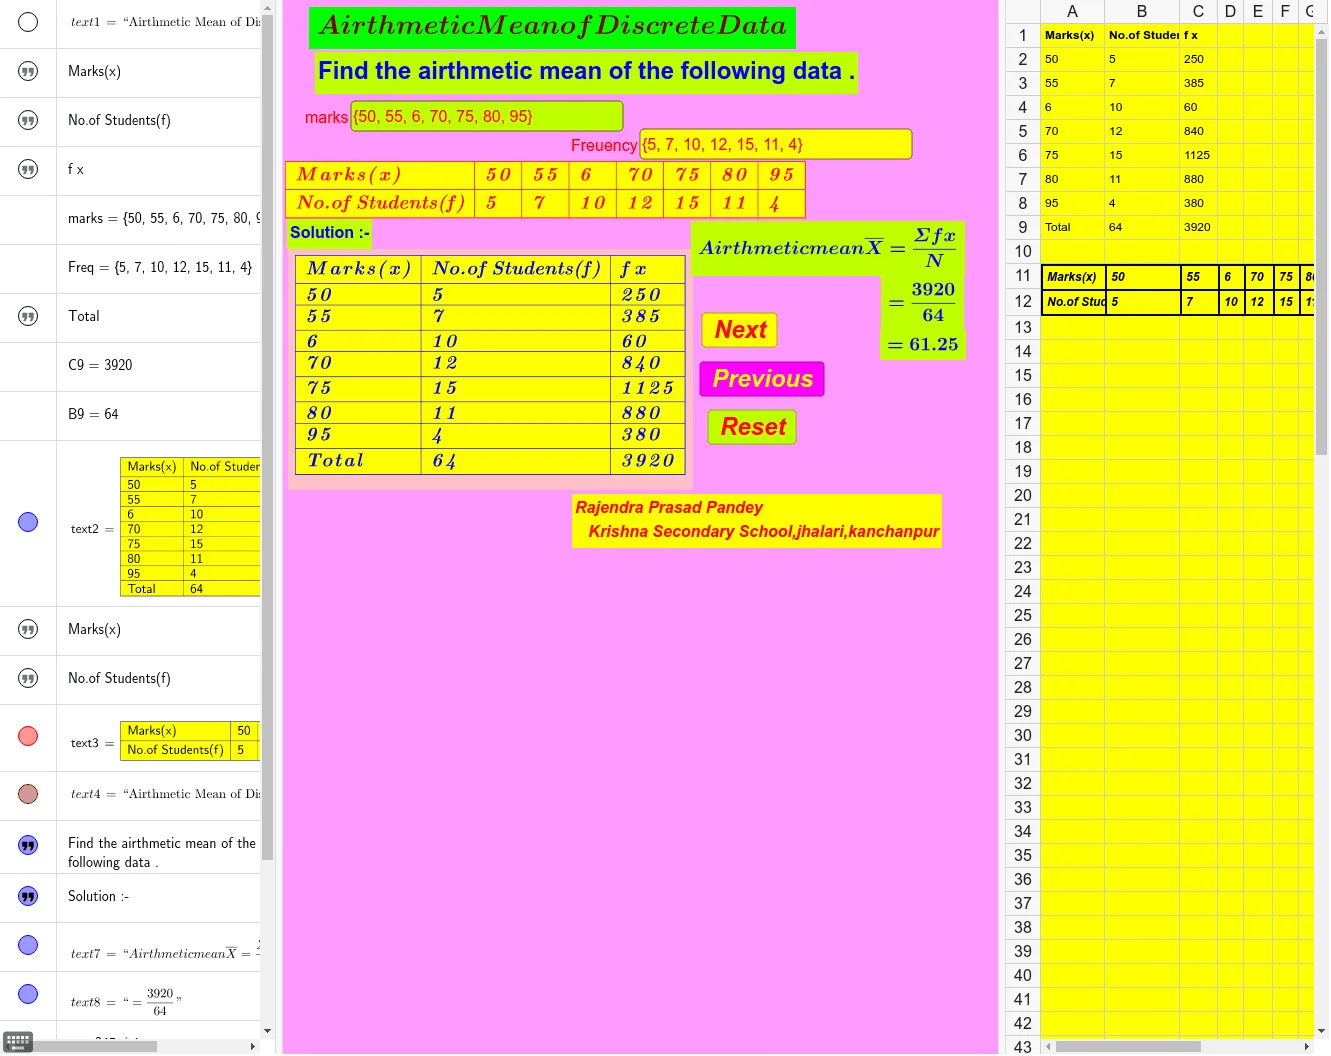
This example demonstrates the calculation and visualization of the arithmetic mean for discrete data, using a table-based layout to show values and their corresponding frequencies. Core mathematical concepts include discrete data, frequency distribution, arithmetic mean, summation, and measures of central tendency. The construction relies on GeoGebra commands such as Element, Sum, TableText, and Textfield, together with objects including text1, A1–C1, marks, Freq, A2–C8, A9–C9, text2, and A11–H11, enabling dynamic data referencing, summation, and on-screen text display. It is suitable for middle school and high school probability and statistics instruction, as well as introductory data analysis and classroom demonstrations.
GeoGebra Commands & Parameters
Element(marks, 1) → A2Element(marks, 2) → A3Element(marks, 3) → A4Element(marks, 4) → A5Element(marks, 5) → A6Element(marks, 6) → A7Element(marks, 7) → A8Element(Freq, 1) → B2Element(Freq, 2) → B3Element(Freq, 3) → B4Element(Freq, 4) → B5Element(Freq, 5) → B6Element(Freq, 6) → B7Element(Freq, 7) → B8Sum(C2:C8) → C9Sum(B2:B8) → B9TableText({{A1, B1, C1}, {A2, B2, C2}, {A3, B3, C3}, {A4, B4, C4}, {A5, B5, C5}, {A6, B6, C6}, {A7, B7, C7}, {A8, B8, C8}, {A9, B9, C9}}, "|_lll") → text2Element(marks, 1) → B11Element(marks, 2) → C11Element(marks, 3) → D11Element(marks, 4) → E11Element(marks, 5) → F11Element(marks, 6) → G11Element(marks, 7) → H11Element(Freq, 1) → B12Element(Freq, 2) → C12Element(Freq, 3) → D12Element(Freq, 4) → E12Element(Freq, 5) → F12Element(Freq, 6) → G12Element(Freq, 7) → H12TableText({{A11, B11, C11, D11, E11, F11, G11, H11}, {A12, B12, C12, D12, E12, F12, G12, H12}}, "|_llllllll") → text3Textfield(marks) → InputBox1Textfield(Freq) → InputBox2
AI Drawing Prompt Reference
Draw a demonstration of the arithmetic mean for discrete data using two tables. The left table is vertical with three columns—value, frequency, and value times frequency—for seven data rows, and shows the sum of frequencies and the sum of products at the bottom. The right table is horizontal, with the seven values in the first row and their frequencies in the second row. Below the tables, provide two editable input boxes, one for the list of values and one for the list of frequencies, so the user can change the data and see the sums update automatically.
The prompt above was compiled from the original drawing commands and is for reference only.