
Area of a rectangle as a function of x by Liza Cross
Loading the math board and drawing, please wait…
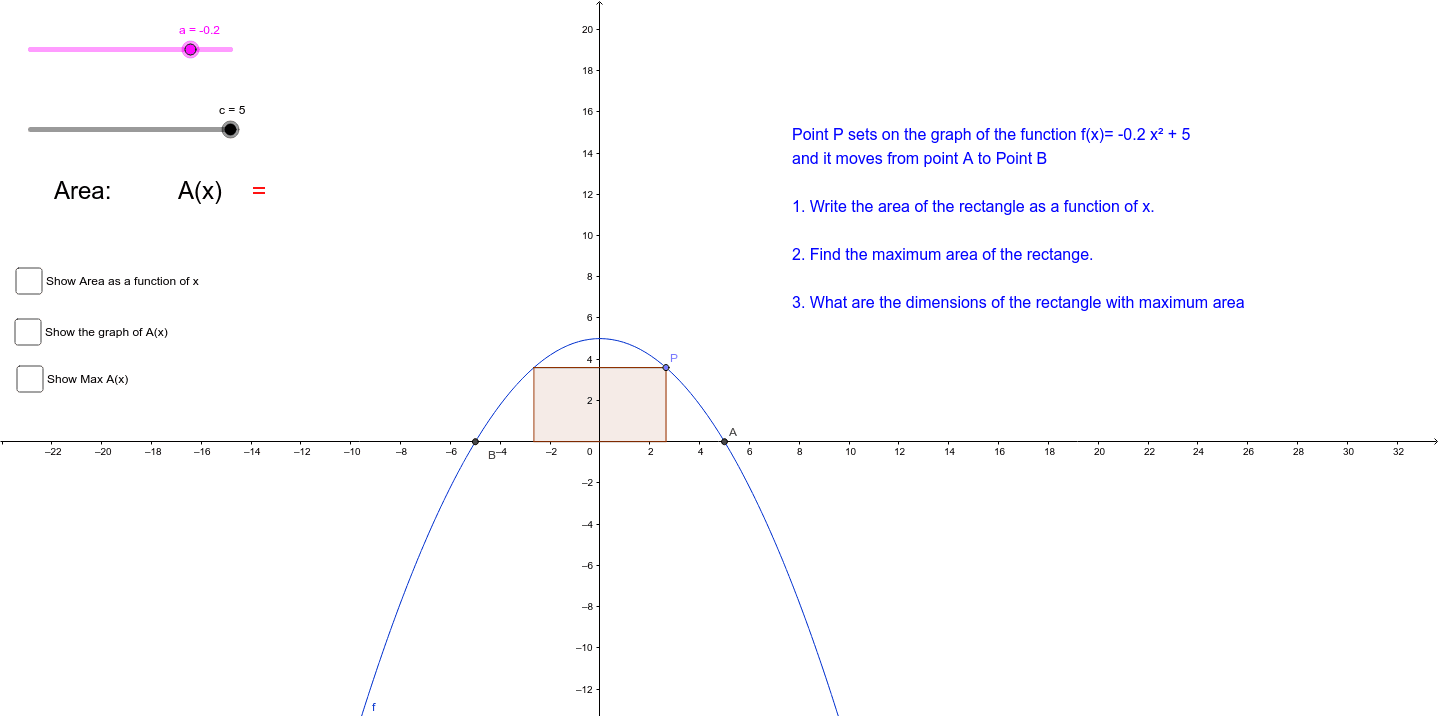
This example demonstrates how the area of a rectangle changes with its dimensions. Key mathematical concepts include the area formula, function graphs, and geometric construction. The GeoGebra commands used include Roots, Point, Line, OrthogonalLine, etc., to draw rectangles and area functions. Suitable for middle or high school mathematics to understand the relationship between area and variables.
GeoGebra Commands & Parameters
Roots(f, -6, 20) → B, APoint(f) → PLine(P, xAxis) → dOrthogonalLine(P, xAxis) → eOrthogonalLine(P, xAxis) → iIntersect(i, xAxis) → JMirror(P, yAxis) → P'OrthogonalLine(P, xAxis) → hOrthogonalLine(P', xAxis) → jSegment(P, P') → kIntersect(j, xAxis) → CIntersect(h, xAxis) → DPolygon(P, D, C, P') → poly1, p, d_1, c_1, p'Max(g, 0, x(A)) → E
AI Drawing Prompt Reference
Draw a graph showing the area of a rectangle as a function of its width. One side of the rectangle is fixed, while the other side varies. The graph should display the relationship between area and width, showing how the area changes as the width increases. Include the rectangle, axes, and a curve to clearly illustrate the relationship.
The prompt above was compiled from the original drawing commands and is for reference only.