
Area Between Two Function Graphs - Transformation
Loading the math board and drawing, please wait…
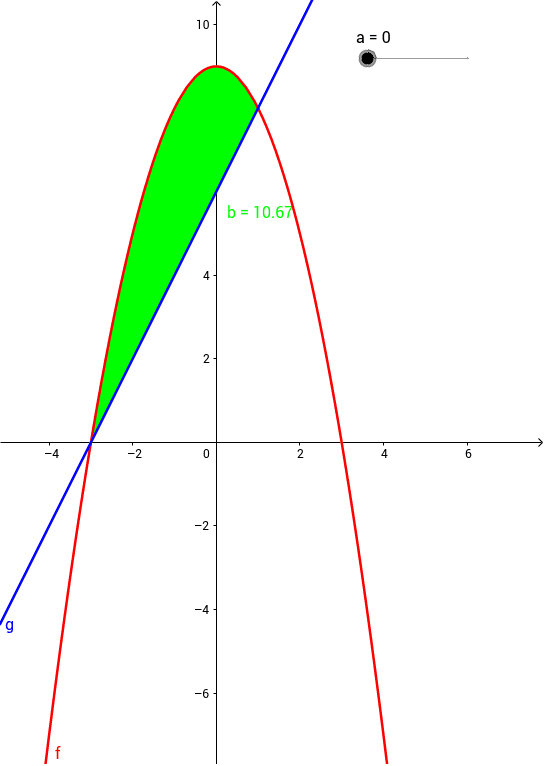
This example demonstrates how to represent the area between two function graphs using the difference function and the x-axis. Key mathematical concepts include functions and integrals. It utilizes GeoGebra commands such as Intersect, Polynomial, Integral, Root, and IntegralBetween. Suitable for high school mathematics education and learning integral concepts.
GeoGebra Commands & Parameters
Intersect(g, f) → A, BPolynomial(f(x) - g(x)) → hIntegral(h, 0, x(B)) → cRoot(h) → C, DIntegral(h, x(C), x(D)) → a_1IntegralBetween(f, g, x(A), x(B)) → b
AI Drawing Prompt Reference
Draw the area between two function graphs, showing their intersection points, then create a new function graph as the difference of the two original functions. Shade the area between this new function and the x-axis to represent an integral, and label the integral from the left intersection point to the x-axis and the integral between the two intersection points. Use different colors to distinguish the left integral area and the entire integral area.
The prompt above was compiled from the original drawing commands and is for reference only.