
Approximating Gradient of a Parabola
Loading the math board and drawing, please wait…
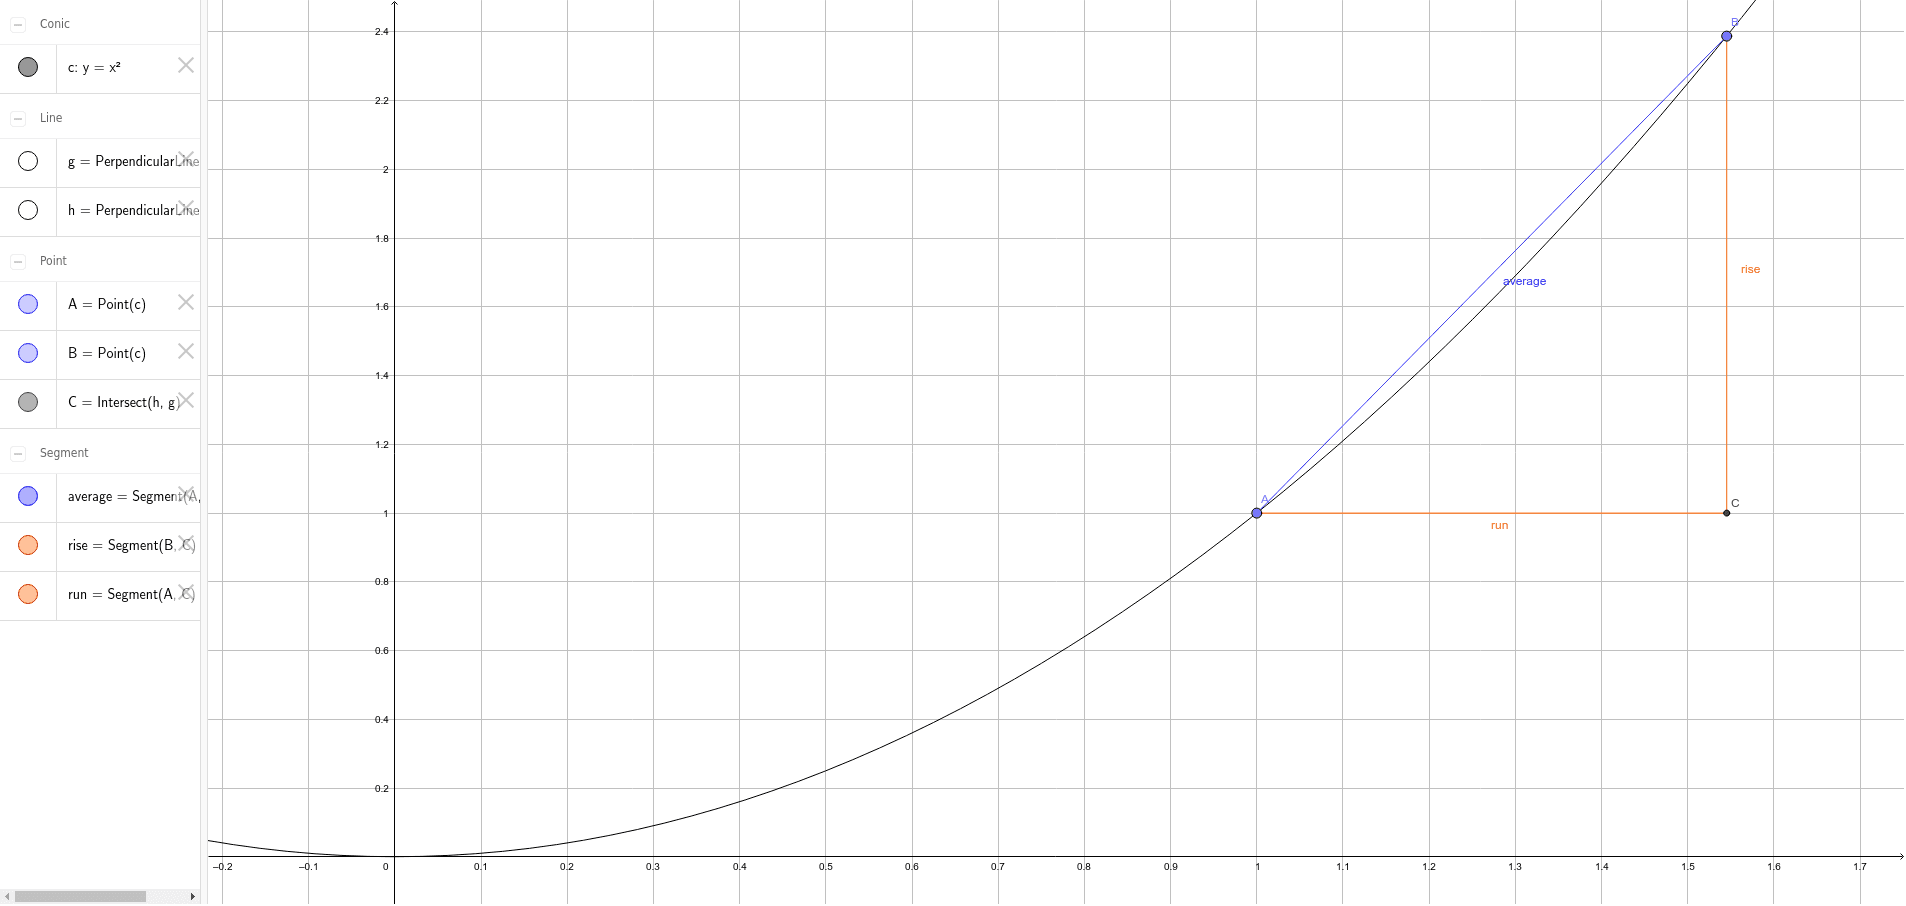
① This GeoGebra example dynamically demonstrates how to approximate the slope of a tangent line to a parabola at a point using a secant line, visualizing the geometric meaning of the derivative. ② Core mathematical concepts include parabolas, secant slope, tangent slope, derivative definition, and the limit concept, integrating function graphing and coordinate geometry. ③ Construction details: Point creates points A and B on the parabola, Segment connects them to form a secant, OrthogonalLine constructs a perpendicular line through A (indicating tangent direction), Intersect finds intersection points, and rise/run are used to compute the slope. Dragging point B or using a slider changes the secant, showing the slope approaching the tangent slope. ④ Suitable for high school or introductory college calculus students to grasp the geometric intuition of derivatives, and useful for classroom demonstrations or self-study.
GeoGebra Commands & Parameters
Point(c) → APoint(c) → BSegment(A, B) → averageOrthogonalLine(B, xAxis) → gOrthogonalLine(A, g) → hIntersect(h, g) → CSegment(B, C) → riseSegment(A, C) → run
AI Drawing Prompt Reference
Draw a parabola and select two points on it to form a secant line. From one point, draw a vertical line to the x-axis and another perpendicular to the secant line, intersecting at a point. The segment between the intersection of the secant and the vertical line represents the secant slope, while the segment between the intersection and the perpendicular line shows the tangent direction. Moving one point or using a slider to change the secant line demonstrates how the secant slope approaches the tangent slope, visualizing the derivative concept.
The prompt above was compiled from the original drawing commands and is for reference only.