
Applications of Logarithmic Functions: A GeoGebra Visual Study
Loading the math board and drawing, please wait…
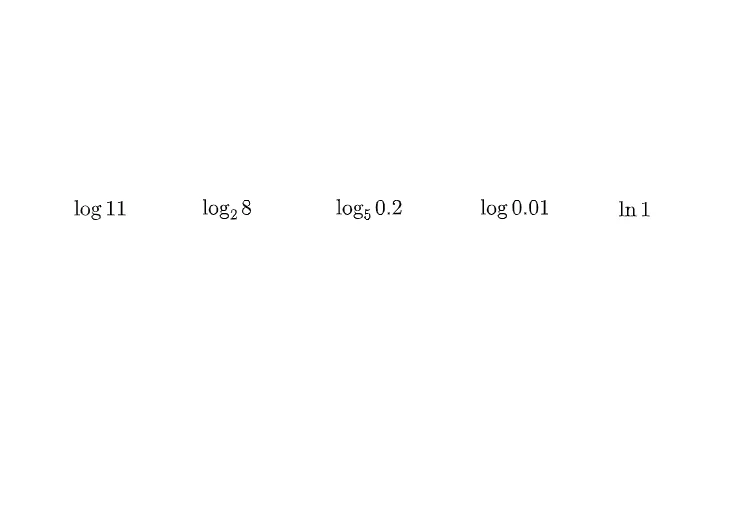
This GeoGebra example demonstrates how common applications of logarithmic functions can be presented and checked through an interactive, visual setup. It centers on key concepts such as the properties of logarithmic functions (e.g., domain behavior, the role of the base, and related transformations) and on interpreting algebraic relationships by reading and analyzing their graph features. Construction-wise, the available “construction summary” indicates multiple annotation objects (text1–text5), which are used to label the scenario, highlight the main logarithmic expressions/variables, and synchronize explanations with the displayed relationships. Even though the command list provided only names the text objects, the educational intent is to pair those annotations with function graphing in the coordinate plane so learners can connect formulae to visual evidence. Suitable for late middle school through high school algebra classes, and also useful for teacher-led demonstrations, guided practice, and reinforcing conceptual understanding of logarithmic modeling via graph interpretation.
AI Drawing Prompt Reference
Create a coordinate plane with a logarithmic function curve, highlighting its domain, asymptote, and the effect of the base. Add five text labels around the graph to annotate the scenario, emphasize the main logarithmic expressions or variables, and synchronize explanations with the displayed relationships. The graph should clearly show the growth trend and transformations of the logarithmic function, suitable for middle and high school algebra classes to connect formulas with visual evidence.
The prompt above was compiled from the original drawing commands and is for reference only.