
AP Stats Spinner Expected Value Demo
Loading the math board and drawing, please wait…
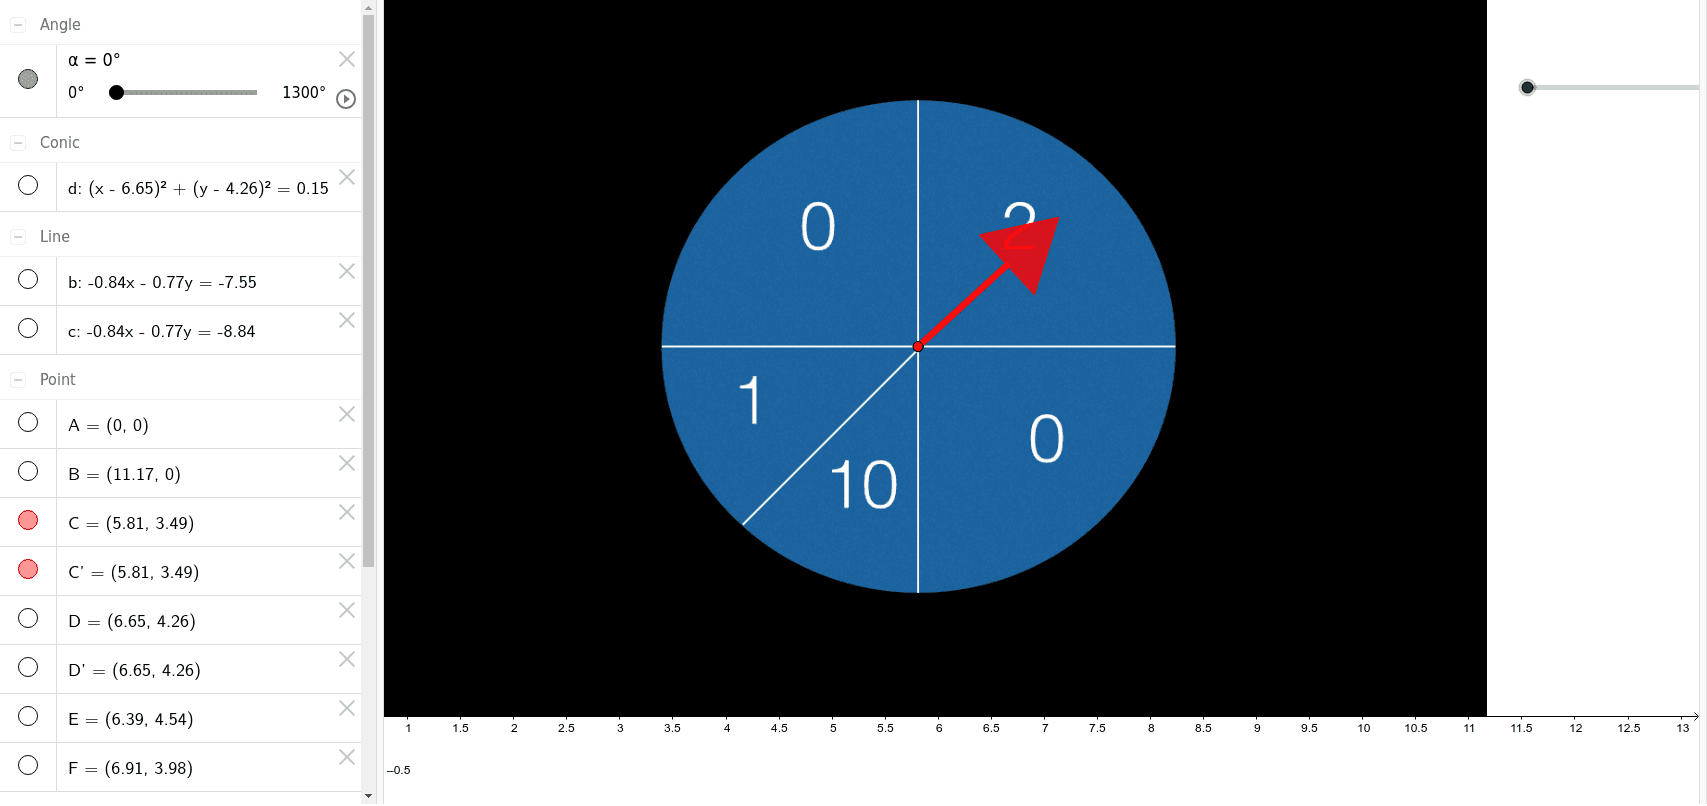
This example demonstrates how to construct a spinner model using GeoGebra and calculate its expected value. Core math concepts include expected value in probability statistics, geometric constructions of points, lines, circles, and polygons. Construction highlights include commands like Segment, OrthogonalLine, Point, Circle, Intersect, Polygon, Rotate, and objects A, B, pic1, C, α, D, a, b, c, E, d, F, poly1, e, f, g, G, C', D', a', poly1'. Suitable for high school AP Statistics courses to help students understand the application of expected value in probability models.
GeoGebra Commands & Parameters
Segment(C, D) → aOrthogonalLine(C, a) → bOrthogonalLine(D, a) → cPoint(c) → ECircle(D, E) → dIntersect(d, c, 2) → FPolygon(E, F, 3) → poly1, e, f, g, GRotate(C, α, C) → C'Rotate(D, α, C) → D'Segment(C', D') → a'Rotate(poly1, α, C) → poly1'