
Analyze Graphs of Several Logarithmic Functions
Loading the math board and drawing, please wait…
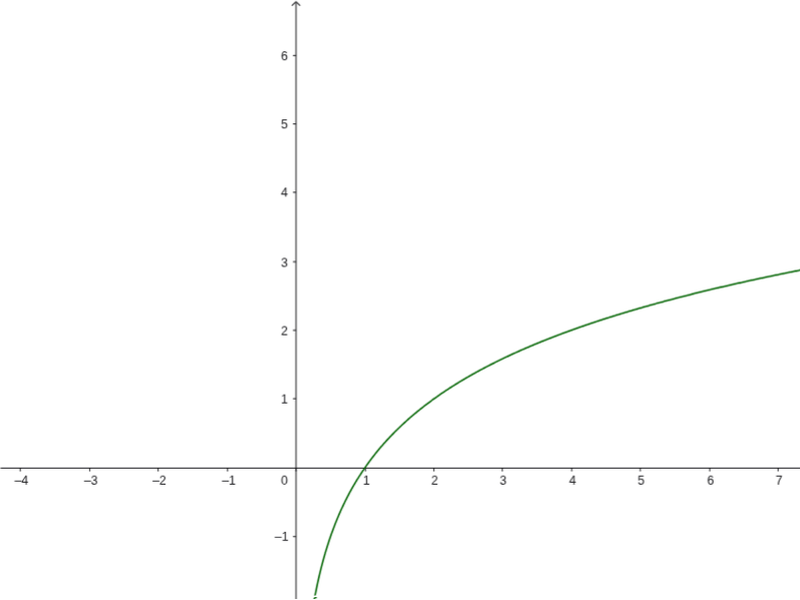
This example demonstrates how to plot and analyze the graphs of several logarithmic functions. Key mathematical concepts include the properties and graph characteristics of logarithmic functions. Using GeoGebra commands, these functions are constructed. Suitable for high school mathematics education, particularly for topics related to function graphs and properties.
GeoGebra Commands & Parameters
f(x) = log(2, x)
AI Drawing Prompt Reference
Draw the graph of a logarithmic function with base 2, where the x-axis represents the input and the y-axis represents the output. The curve should be monotonically increasing, passing through the point (1,0), dropping sharply toward negative infinity as x approaches 0 from the right, and rising slowly for x greater than 1. Include clearly labeled axes with tick marks and a grid to help analyze the function's behavior. The curve should be a smooth solid line in a prominent color, occupying the main area of the canvas.
The prompt above was compiled from the original drawing commands and is for reference only.