
Alpha Beta Power Hypothesis Testing
Loading the math board and drawing, please wait…
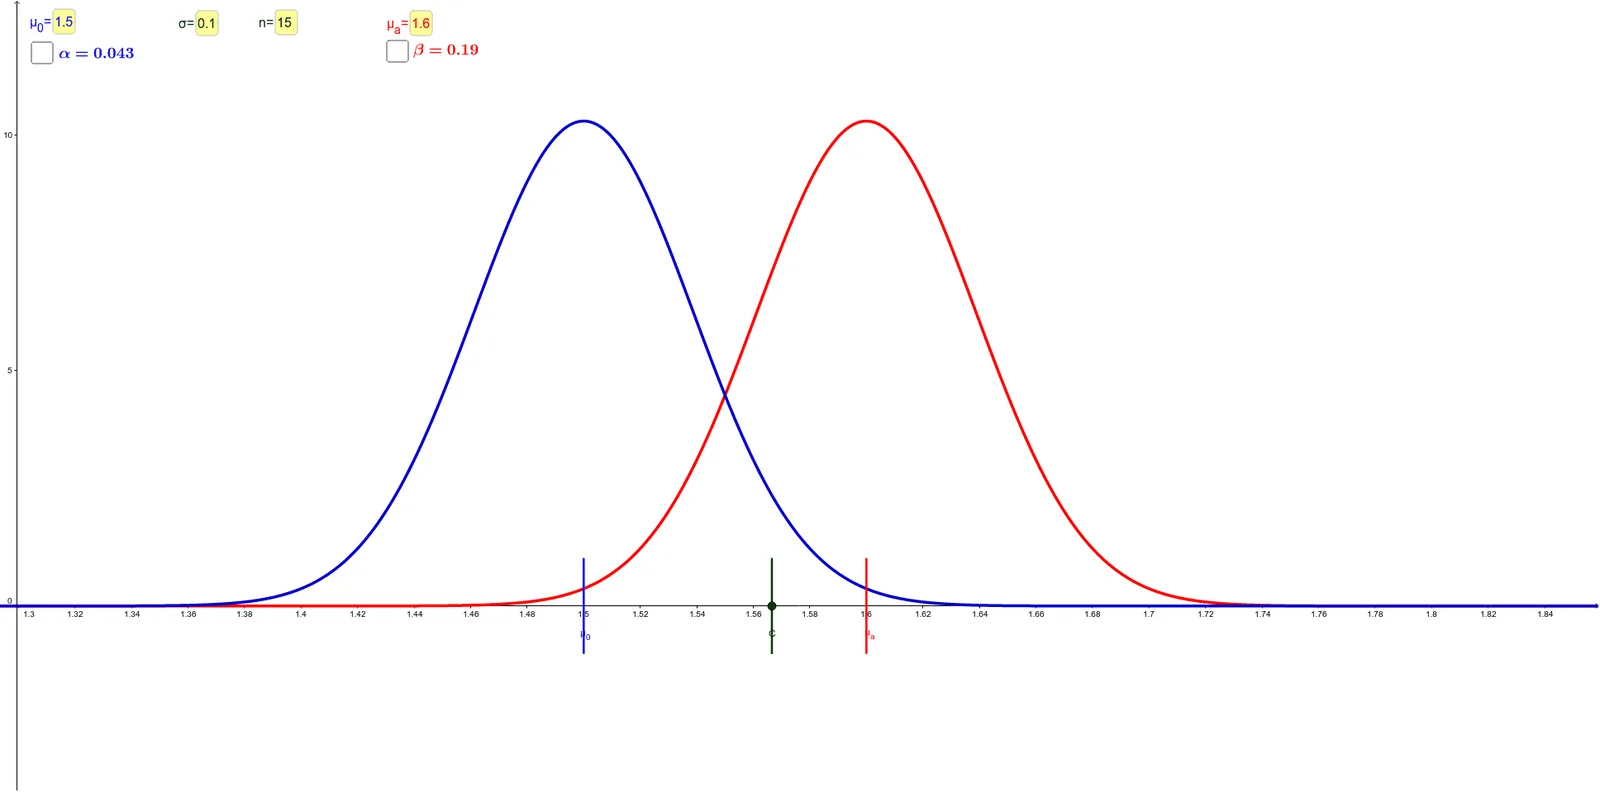
This example demonstrates the relationship between Type I and Type II error probabilities (α and β) and the power of a hypothesis test. It involves core concepts in probability & statistics, integral calculus, and geometry of ellipses and cones. Constructed using commands like Point, Normal, OrthogonalLine, Integral, Textfield, Segment. Suitable for high school students and educators needing a deeper understanding of statistical inference.
GeoGebra Commands & Parameters
Point(xAxis) → CNormal(μ_1, σ / n^(0.5), x, true) → IN_0Normal(μ_2, σ / n^(0.5), x, true) → IN_aNormal(μ_2, σ / n^(0.5), x) → N_aNormal(μ_1, σ / n^(0.5), x) → N_0OrthogonalLine(C, xAxis) → aIntegral(N_0, x(C), x(C) + (3 * σ / n^(0.5))) → I_0Textfield(n) → inputBox1Textfield(σ) → inputBox2Textfield(μ_0) → inputBox3Textfield(μ_a) → inputBox4OrthogonalLine(A, xAxis) → cOrthogonalLine(B, xAxis) → dIntegral(N_a, x(C) - (3 * σ / n^(0.5)), x(C)) → I_aSegment(FA, EA) → gSegment(FB, EB) → iPoint(i) → ESegment(EC, FC) → f
AI Drawing Prompt Reference
Draw a graph demonstrating the relationship between Type I and Type II error probabilities (α and β) and the power of a hypothesis test. Include an x-axis and a point, then draw two normal distribution curves originating from this point, representing normal distributions with different means. Mark two points on the x-axis, draw perpendicular lines from these points, forming two regions. Use integrals to represent the areas of these regions and label the corresponding probabilities. Finally, connect relevant points with line segments to form a geometric shape, and add text boxes to display parameter values.
The prompt above was compiled from the original drawing commands and is for reference only.