
Adding and Subtracting Linear Functions Exercise
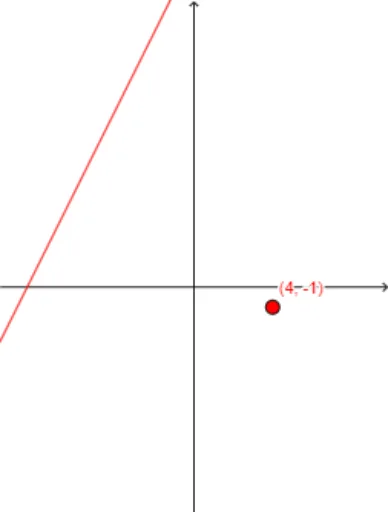
Loading the math board and drawing, please wait…
This example demonstrates how to draw two linear functions using GeoGebra and display their sum and difference. Core math concepts include function addition, subtraction, properties of linear functions, and function graph transformations. Construction highlights involve commands like Random, Textfield, RandomElement, Polygon, TableText, and LaTeX to generate random linear functions and dynamically show their sums and differences. Suitable for high school students to understand function operations and graph transformations, or for teaching demonstrations.
GeoGebra Commands & Parameters
Random(1, 5) → deltaxRandom(-10, 10) → d_1Textfield(g) → InputBox1RandomElement({-5, -4, -3, -2, -1, 1, 2, 3, 4, 5}) → a_1RandomElement({-5, -4, -3, -2, -1, 1, 2, 3, 4, 5}) → c_1Textfield(m) → InputBox2Polygon(B, C, D, E) → poly1, b_2, c_1, d_2, e_1TableText({{A3, B3, C3, D3}, {A4, B4, C4, D4}, {A5, B5, C5, D5}, {A6, B6, C6, D6}, {A7, B7, C7, D7}, {A8, B8, C8, D8}, {A9, B9, C9, D9}, {A10, B10, C10, D10}}, "|_r") → text1LaTeX(a, true, true) → text10LaTeX(b, true, true) → text11LaTeX(c, true, true) → text12LaTeX(d_1, true, true) → text13Random(1, 10) → nRand