
Absolute Value Functions: Graph Transforms (Part 2)
Loading the math board and drawing, please wait…
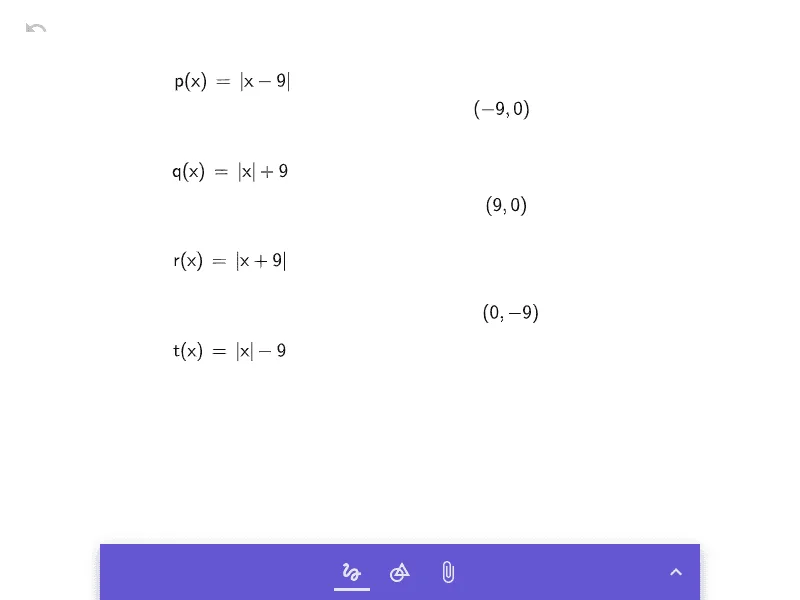
This example demonstrates how absolute value functions form characteristic V-shaped (piecewise linear) graphs and how their shape changes when parameters are adjusted. It highlights the geometric meaning of |x|, the piecewise nature of the function (the expression switches when the absolute value’s inside changes sign), and key graph features such as the vertex (turning point), symmetry, and the relationship between slope and function definition on each side of the breakpoint. The construction is centered on graphing the absolute value function and emphasizing critical points/segments on the coordinate plane; the provided construct summary is empty, so no specific GeoGebra commands are listed, but the intended workflow is function graph visualization with highlighted points to reveal the piecewise behavior. Suitable for upper secondary students and early college learners, as well as for pre-calculus study of function graphs and modeling.
AI Drawing Prompt Reference
Graph an absolute value function to display its V-shape, highlighting key features: the vertex as a turning point, the axis of symmetry, and the slope changes in each linear segment. Use distinct colors or markers to emphasize the piecewise behavior, showing how the function changes form when the expression inside the absolute value changes sign, and illustrate the symmetry and slope relationships.
The prompt above was compiled from the original drawing commands and is for reference only.