
Absolute Maximum and Minimum
Loading the math board and drawing, please wait…
In collections
Calculus 1 Graphical Illustrations
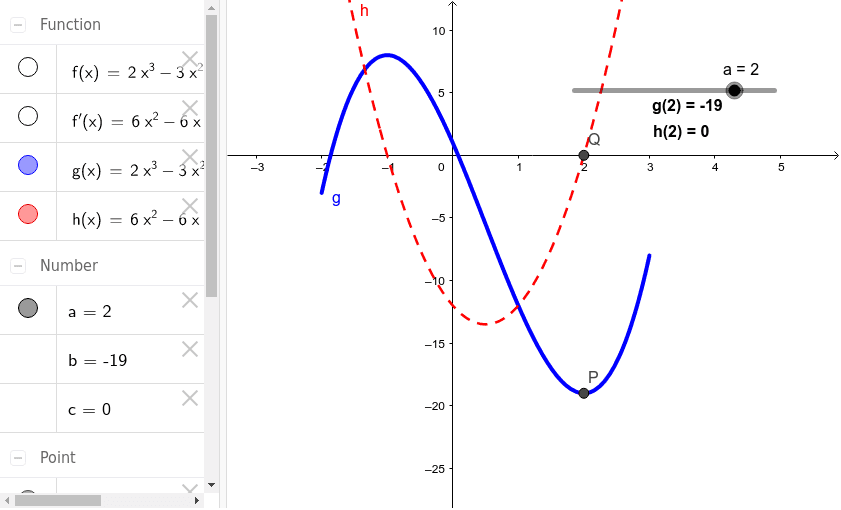
This example demonstrates how to find the absolute maximum and minimum values on a function graph. Core math concepts include functions, derivatives, and optimization. Constructed using GeoGebra commands/objects: f (function), f' (derivative), a, b, c (parameters), P, Q (points), g, h (auxiliary objects), text1, text2 (texts). Suitable for high school calculus teaching to understand function extrema and their methods.
GeoGebra Commands & Parameters
f(x) = (2 * x^(3)) - (3 * x^(2)) - (12 * x) + 1f'(x) = f'(x)Numeric a(2.0)(a, f(a))(a, f'(a))y(P)y(Q)g(x) = If[-2 ≤ x ≤ 3,f(x)]h(x) = If[-2 ≤ x ≤ 3,f'(x)]
AI Drawing Prompt Reference
Draw the function f(x) = 2x³ - 3x² - 12x + 1 and its first derivative f'(x). Find the absolute maximum and minimum values of the function. First, plot the function curve, then calculate and mark the derivative curve, next determine the critical points of the function, and finally use auxiliary functions g and h to represent the function and its derivative within the domain [-2, 3].
The prompt above was compiled from the original drawing commands and is for reference only.