
3D Implicit Surface Grapher: Goursat's Surface
Loading the math board and drawing, please wait…
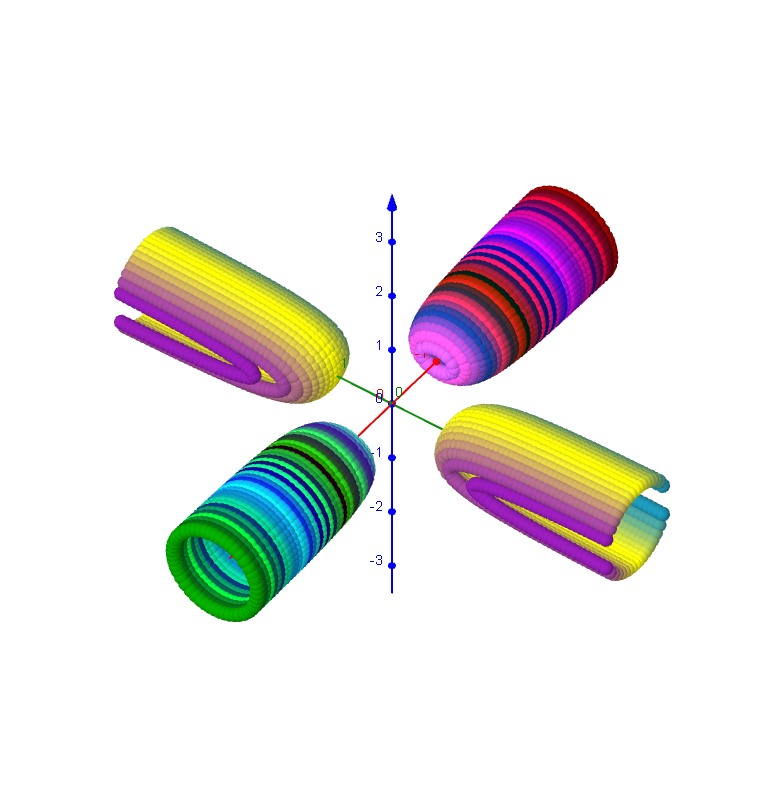
This interactive GeoGebra example demonstrates the graphing of 3D implicit surfaces, with a focus on Goursat's surface, a classic algebraic surface. Core mathematical concepts include implicit equations, 3D parameterization, polynomial functions, and surface geometry. Construction highlights: using GeoGebra's text fields (Textfield) and buttons (button), the applet predefines 14 algebraic and 14 polynomial functions for selection; sliders (dx2, dy2, dz2) adjust the plotting ranges (x_min, x_max, y_min, y_max, z_min, z_max) and update the surface in real time; objects include function definitions (Funktion), color selection (Farbe), and multiple text labels (text1, text2, etc.) for interface guidance. Suitable for high school to university-level mathematics education, this tool helps students intuitively understand implicit surfaces, polynomial equations, and 3D visualization, and can be used to explore the topology and symmetry of special surfaces like Goursat's surface.
GeoGebra Commands & Parameters
Textfield(x_{min}) → Textfeld1Textfield(y_{min}) → Textfeld2Textfield(z_{min}) → Textfeld3Textfield(x_{max}) → Textfeld4Textfield(y_{max}) → Textfeld5Textfield(z_{max}) → Textfeld6Textfield(Nn) → Textfeld10Textfield(g) → Textfeld13Textfield(b) → inputBox1
AI Drawing Prompt Reference
Create a 3D implicit surface plot focusing on Goursat's surface, a classic algebraic surface. The interface includes six input fields for setting the minimum and maximum plotting ranges along the x, y, and z axes, plus three additional fields for adjusting grid density, surface parameters, and color. Sliders allow real-time updates of the plotting ranges, causing the surface to redraw dynamically. Multiple predefined algebraic and polynomial functions are available for selection, each generating a distinct surface shape. The surface is displayed in color, with text labels providing guidance. This visualization is intended for exploring implicit equations, polynomial functions, and 3D geometry in an educational context.
The prompt above was compiled from the original drawing commands and is for reference only.