
3D Fourier Transform Visualization
Loading the math board and drawing, please wait…
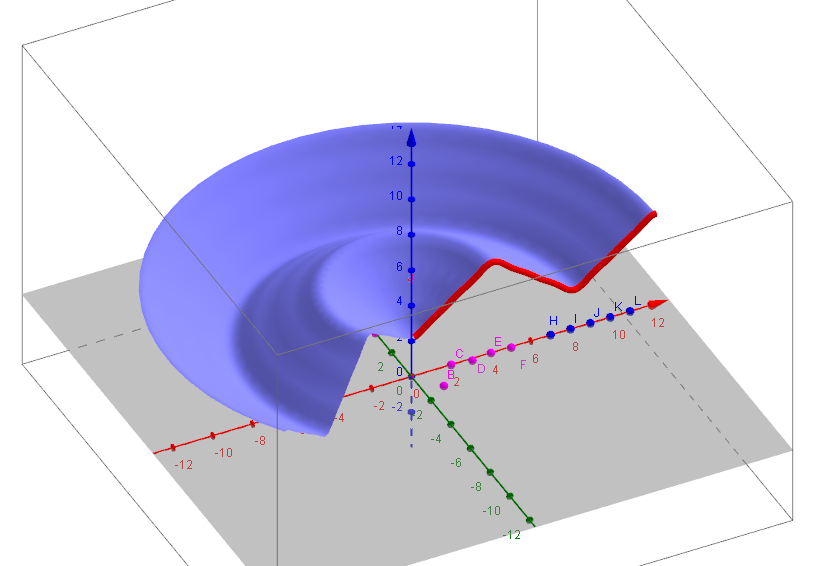
This example visualizes 3D Fourier transforms. It involves concepts of trigonometric functions and Fourier series. Using commands like PointIn, Sequence, Surface, and CurveCartesian, users can construct complex 3D shapes. Suitable for high school and above students or teachers for teaching and learning Fourier transforms.
GeoGebra Commands & Parameters
PointIn(x + 0z = 1) → BPointIn(x + 0z = 2) → CPointIn(x + 0z = 3) → DPointIn(x + 0z = 4) → EPointIn(x + 0z = 7) → HPointIn(x + 0z = 8) → IPointIn(x + 0z = 9) → JPointIn(x + 0z = 10) → KPointIn(x + 0z = 11) → LPointIn(x + 0z = 5) → FPointIn(x + 0z = 0) → ASequence((k + 6, ((-1)^(k + 1) * 2 / k)), k, 1, 5) → dentSequence((k, (2 / ((π * k^(2))) * (cos((k * π)) - 1))), k, 1, 5) → triSequence((i, (6 / ((i * π)) * sin((i * π / 2)))), i, 1, 5) → crenSurface((u * cos(v)), (u * sin(v)), f(u), u, 0, (eu * T), v, 0, ev) → sCurveCartesian(t, 0, f(t), t, 0, (eu * T)) → dCurveCartesian(t, f(t), t, 0, (eu * T)) → c