
200 Meter Distance Sketch
Loading the math board and drawing, please wait…
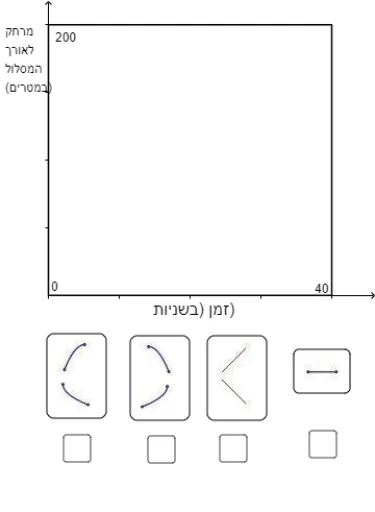
This example demonstrates the calculation and graphical representation of a 200-meter distance. It involves core mathematical concepts such as logarithms, ratios, statistics, hypothesis testing, and area calculation. Construction highlights include using GeoGebra commands like Line, Point, OrthogonalLine, Intersect, Textfield, Polygon, RotateText, Segment, TableText, and Mirror. Suitable for high school students and educators for teaching demonstrations and concept understanding.
GeoGebra Commands & Parameters
Line(C, xAxis) → l_9Line(D, l_9) → jPoint(l_9) → EOrthogonalLine(E, l_9) → kIntersect(j, k) → FPoint(l_9) → HOrthogonalLine(H, l_9) → lPoint(l) → IOrthogonalLine(I, l) → l_6Point(l) → JOrthogonalLine(J, l) → l_3Point(l_6) → LOrthogonalLine(L, l_6) → l_7Intersect(l_7, l_3) → MTextfield(t) → InputBox4Polygon({(0, 0), (40, 0), (40, 20), (0, 20)}) → poly2Textfield(n_1) → InputBox7RotateText(" distance along track (meters)", 90°) → text8Point(yAxis) → SSegment(S, T) → mascIntersect(f_1, masc) → UIntersect(p_1, masc) → WPolygon((0, 3), (200, 3), (200, -5), (0, -5)) → poly1, maslul, masl, masb, maseSegment((0, 1.4), (200, 1.4)) → masmSegment((0, -0.2), (200, -0.2)) → masnSegment((0, -1.8), (200, -1.8)) → masdSegment((0, -3.4), (200, -3.4)) → masfTableText({{tab_5, tab_1, tab_2, tab_3, tab_4}, {A2, B2, C2, D2, E2}, {A3, B3, C3, D3, E3}, {A4, B4, C4, D4, E4}, {A5, B5, C5, D5, E5}, {A6, B6, C6, D6, E6}, {A12, B12, C12, D12, E12}}, "|_") → text7OrthogonalLine(Q, xAxis) → l_2Mirror(P, l_2) → P'OrthogonalLine(R, xAxis) → l_8Mirror(A_1, l_8) → B_1Segment(C_1, D_1) → masLine(E_1, xAxis) → l_4Point(l_4) → F_1Segment(E_1, F_1) → masa