
哪种平均值最合适?集中趋势度量交互练习
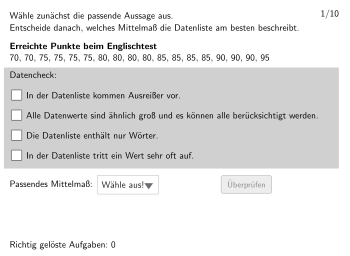
几何画板及绘图内容加载中,请稍等……
本范例通过互动练习帮助学生理解和比较算术平均数、众数和中位数三种集中趋势度量。学生可以输入数据,观察不同平均值的特点,并学会根据数据分布选择最合适的平均值类型。构造要点:使用Textfield和InputBox收集数据,Shuffle随机打乱问题顺序,通过If条件判断和validate验证答案,attemptCount和correctCount记录答题情况。适合5-6年级学生学习数据的收集、整理与表示,培养数据分析与统计思维能力。
GeoGebra 命令及参数
Textfield(input1) → InputBox1Textfield(input2) → InputBox2Shuffle({1, 2, 3, 4, 5, 6, 7, 8, 9, 10}) → randomBsp, {2, 8, 3, 6, 9, 5, 7, 4, 10, 1}SelectedIndex(list1) → index1IndexOf(true, checks) → index2If(check1, C, If[check2, D, If[check3, E, If[check4, F]]]) → PosIf(check1, C1, If[check2, D1, If[check3, E1, If[check4, F1]]]) → Pos1Polygon(PtopLeftCornerFeedback, PtopRightCornerFeedback, PbottomRightCornerFeedback, PbottomLeftCornerFeedback) → rectangleCorrect, rectangleCorrectS3, rectangleCorrectS4, rectangleCorrectS2, rectangleCorrectS1Polygon(box1, box2, box3, box4) → q1, g, h, i, jIf(corList2(bsp) ≟ 1, C, If[corList2(bsp) ≟ 2, D, If[corList2(bsp) ≟ 3, E, If[corList2(bsp) ≟ 4, F]]]) → PosSolIf(corList2(bsp) ≟ 1, C1, If[corList2(bsp) ≟ 2, D1, If[corList2(bsp) ≟ 3, E1, If[corList2(bsp) ≟ 4, F1]]]) → Pos1SolPolygon(PtopLeftCornerFeedbackSol, PtopRightCornerFeedbackSol, PbottomRightCornerFeedbackSol, PbottomLeftCornerFeedbackSol) → rectangleSol, ptopleftcornerfeedbacksol, ptoprightcornerfeedbacksol, pbottomrightcornerfeedbacksol, pbottomleftcornerfeedbacksol
AI 绘图提示语参考
这是一个用于统计练习的图形,包含三个输入框用于输入数据,以及一个随机化问题列表。用户可以选择问题,然后根据答案选择正确的图形。图形包括一个矩形和一些反馈区域,用于显示正确或错误的答案。
以上提示语为根据原始绘图命令整理而来,仅供参考。