
二元函数可视化(第三版)
几何画板及绘图内容加载中,请稍等……
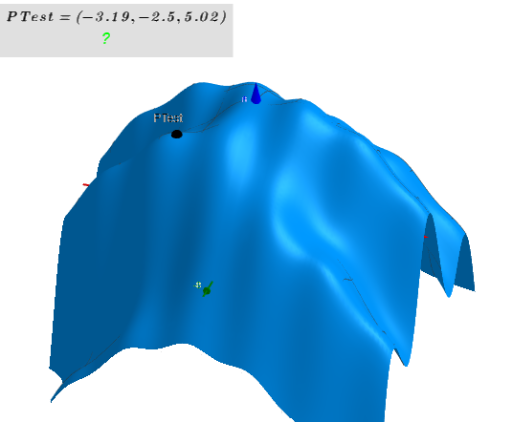
① 本范例演示如何通过GeoGebra动态可视化二元函数 z=f(x,y) 的曲面、等高线及相关的几何量,帮助直观理解三维空间中的函数图像。② 核心数学概念包括二元函数、曲面、等高线(隐式曲线)、微分方程、体积与频率分布,涉及函数、微积分与解析几何的交叉应用。③ 作图要点:从构造摘要可见,使用了 Polygon、ImplicitCurve、IntersectPath、Locus、PolyLine 等命令构建曲面与路径;通过 Sequence、Zip、Text、Join 等实现动态文本与序列;利用 Slider(滑块)调节参数,配合 Point、Vector、Line 等构造辅助元素;还涉及 RemoveUndefined、Sum、Length 等处理数据与计算。④ 适合高中至大学阶段的数学教学,尤其适用于多元函数微积分、微分方程可视化及数学实验课程,也可用于教师制作交互式课件。
GeoGebra 命令及参数
Polygon((x_{max}, y_{max}), (x_{min}, y_{max}), (x_{min}, y_{min}), (x_{max}, y_{min})) → VV, j, t, c, dIf(b_a, Nx_a, 1) → Nx1_aPolygon((x((ro; α)), y((ro; α)), z_{min}) + PTest, (x((ro; α + 180°)), y((ro; α + 180°)), z_{min}) + PTest, (x((ro; α + 180°)), y((ro; α + 180°)), z_{max}) + PTest, (x((ro; α)), y((ro; α)), z_{max}) + PTest) → poly1, k, l, m, pImplicitCurve(f(x, y) - f(x(C), y(C))) → ICurve_2IntersectPath(plane0, f(x, y)) → ICurve_3Point(ICurve_2) → R0Length(lr2) → llr2Sequence((x(Element[lr2, i]), y(Element[lr2, i]), f(x(Element[lr2, i]), y(Element[lr2, i]))), i, 1, llr2) → lllPmin01If(Length[lllPmin01] ≟ 0, false, true) → bwllPmin01Length(lr1) → llr1Sequence((x(Element[lr1, i]), y(Element[lr1, i]), f(x(Element[lr1, i]), y(Element[lr1, i]))), i, 1, llr1) → lllPmax01If(Length[lllPmax01] ≟ 0, false, true) → bwllPmax01If(bwllPmax01, Max[z(lllPmax01)], 1000) → Maxz0If(bwllPmax01, IndexOf[Maxz0, Sequence[z(Element[lllPmax01, i]), i, 1, Length[lllPmax01]]], 1000) → Indexmaxz0If(b, true, false) → hIf(h, Nx, 1) → Nx1Length(lr3) → llr3Point(Segment[(0, 0), (6.28319, 0)]) → AfPoint(Segment[Px2, Px1]) → AxPoint(Segment[Py2, Py1]) → AyTextfield(N_{V1}) → inputBox1Textfield(x_{min}) → inputBox2Textfield(x_{max}) → inputBox3Textfield(y_{min}) → inputBox4Textfield(y_{max}) → inputBox5Textfield(f) → inputBox6Textfield(z_{min}) → inputBox7Textfield(z_{max}) → inputBox8Point(Segment[Pz2, Pz1]) → AzTextfield(ω_c) → inputBox9Textfield(vt) → inputBox10Sum(Sequence[If[f(x(PTest), y(PTest)) - f(x(Element[lr01, i]), y(Element[lr01, i])) > 0, 1, 0], i, 1, n]) → ext1RotateText("z_{min}=" + z_{min} + "", 90°) → Text2RotateText("z_{max}=" + z_{max} + "", 90°) → Text6Sequence(Segment[Element[l0maxmin2, k], Element[l0maxmin2, k + 1]], k, 1, Length[l0maxmin2]) → linelmaxmin2Sequence(Element[lr1, i], i, 1, llr1) → lPmaxSequence(Element[lr2, i], i, 1, llr2) → lPminSequence(Element[lr3, i], i, 1, llr3) → lPsadIf(bwllPmin01, Min[z(lllPmin01)], 1000) → Minz0If(bwllPmin01, IndexOf[Minz0, Sequence[z(Element[lllPmin01, i]), i, 1, Length[lllPmin01]]], 1000) → Indexminz0Element(lr2, Indexminz0) → P_{min0}If(bwllPmin01, Element[lllPmin01, Indexminz0], (1000, 1000, 1000)) → zmin2Point(Liste1) → C111aLocus(C1110a, C111a) → locPolyLine(l0maxmin1) → linelmaxmin11If(bwllPmax01, Element[lllPmax01, Indexmaxz0], (1000, 1000, 1000)) → zmax2RemoveUndefined(Sequence[If[f(x(PTest), y(PTest)) - f(x(Element[lr01, i]), y(Element[lr01, i])) > 0, i, NaN], i, 1, n]) → lr04Zip(Vector[b, a], a, Sequence[Element[lr01, Element[lr04, i]], i, 1, Length[lr04]], b, Sequence[Element[lr02, Element[lr04, i]], i, 1, Length[lr04]]) → lr06Sequence((x(Element[lr01, i]), y(Element[lr01, i]), f(x(Element[lr01, i]), y(Element[lr01, i]))), i, 1, n) → lr013Sequence((x(Element[lr02, i]), y(Element[lr02, i]), f(x(Element[lr02, i]), y(Element[lr02, i]))), i, 1, n) → lr023Zip(Vector[b, a], a, Sequence[Element[lr013, Element[lr04, i]], i, 1, Length[lr04]], b, Sequence[Element[lr023, Element[lr04, i]], i, 1, Length[lr04]]) → lr063Zip(Vector[a, b], a, Sequence[Element[lr01, Element[lr05, i]], i, 1, Length[lr05]], b, Sequence[Element[lr02, Element[lr05, i]], i, 1, Length[lr05]]) → lr07Zip(Vector[a, b], a, Sequence[Element[lr013, Element[lr05, i]], i, 1, Length[lr05]], b, Sequence[Element[lr023, Element[lr05, i]], i, 1, Length[lr05]]) → lr073Textfield(zoom_{3D}) → InputBox1Element(lr1, rmax - 1) → PzmaxElement(lr2, rmin - 1) → PzminElement(lr3, rsad - 1) → PzsadText("( x , y , z )") → TextR01Join({{TextR01}, lllPmax01}) → llPmax01Element(lr1, Indexmaxz0) → P_{max0}Sequence((x(Element[lr3, i]), y(Element[lr3, i]), f(x(Element[lr3, i]), y(Element[lr3, i]))), i, 1, llr3) → lllPspJoin({{TextR01}, lllPmin01}) → llPmin01Join({{TextR01}, lllPsp}) → llPsad01Element(lllPsp, rsad - 1) → Pzsad_{3D}Element(lllPmax01, rmax - 1) → Pzmax_{3D}Element(lllPmin01, rmin - 1) → Pzmin_{3D}Textfield(A) → InputBox2RemoveUndefined(Sequence[If[f(x(PTest), y(PTest)) - f(x(Element[lr01, i]), y(Element[lr01, i])) > 0, i, (-i)], i, 1, n]) → lr04cAppend(lr04c, Element[lr04c, 1]) → lr04ccSum(Sequence[If[(Element[lr04cc, i] * Element[lr04cc, i + 1]) < 0, 1, 0], i, 1, n + 1]) → lr04cccLine(A, RoR) → iImplicitCurve(f(x, y) - zi) → list3ImplicitCurve(f(x, y) - zii) → list4Vector(R0, R41) → w_11Vector(R0, R0 + R11) → u_11Textfield(ω0_c) → InputBox3Textfield(r_a) → InputBox5Point(c) → GPoint(j) → HPoint(w_11, 1) → IVector(F, I_{3D}) → vIf(ext1 ≟ n, 1, If[ext1 ≟ 0, 2, If[lr04ccc > 2 ∧ lr04ccc ≤ 4, 3, 4]]) → rooTextfield(n_c) → InputBox6Textfield(a_c) → InputBox7Textfield(r_{lc}) → InputBox8Textfield(vt) → InputBox9PolyLine(Bl) → BlyPolyLine(Gr) → GryPolyLine(Ro) → RoyTextfield(Nx) → ResolutionTextfield(r) → InputBox11Textfield(v_{m4}) → InputBox4Textfield(Nz) → InputBox10Textfield(n) → InputBox12Textfield(rr) → InputBox13Textfield(r_{ext}) → InputBox14Textfield(v_{zi}) → InputBox15Textfield(d_1) → InputBox16Textfield(f_1) → InputBox17Textfield(v_{m3}) → InputBox18
AI 绘图提示语参考
绘制一个三维坐标系中的二元函数曲面,显示其等高线、极值点(最大值、最小值和鞍点)以及沿特定方向的截面曲线。在底面绘制矩形区域,并添加可调节的滑块和输入框,用于改变函数表达式、坐标范围及参数。用不同颜色区分曲面上的极值点,并显示对应的数值标签。同时绘制函数在某个平面上的交线,以及从极值点出发的梯度向量或轨迹线。整体布局包含坐标轴、网格和动态文本,便于观察函数变化。
以上提示语为根据原始绘图命令整理而来,仅供参考。