
绝对值不等式可视化
几何画板及绘图内容加载中,请稍等……
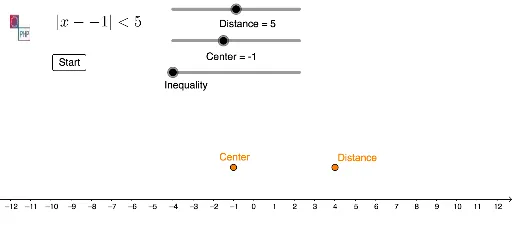
①本范例通过动态演示展示了绝对值不等式在坐标系中的表示区域;②涉及的核心数学概念包括绝对值、不等式解集、区域表示;③作图要点——使用了 GeoGebra 的 If、Segment、Ray 命令,以及 Center、Distance、A、B 等对象来构建图形和动态演示;④适合高中数学学生学习和理解绝对值不等式的几何意义,也可用于微积分和解析几何的教学辅助。
GeoGebra 命令及参数
If(steps > 0 ∧ steps ≤ 1, Segment[A, (x(A) + (steps * Distance), 1)], steps > 1, Segment[A, B]) → fIf(steps > 0 ∧ steps ≤ 1, Segment[A, (x(A) - (steps * Distance), 1)], steps > 1, Segment[A, (x(A) - Distance, 1)]) → gIf(1 < steps < 2, Segment[(x(B), 0), (x(B), (2 * (steps - 1)))], steps ≥ 2, Segment[(x(B), 0), (x(B), 2)]) → hIf(1 < steps < 2, Segment[(x(A) - Distance, 0), (x(A) - Distance, (2 * (steps - 1)))], steps ≥ 2, Segment[(x(A) - Distance, 0), (x(A) - Distance, 2)]) → iIf(1 < steps < 2, Segment[(x(A) - Distance, 0), (x(A) - Distance, (2 * (steps - 1)))], steps ≥ 2, Segment[(x(A) - Distance, 0), (x(A) - Distance, 2)]) → jIf(1 < steps < 2, Segment[(x(B), 0), (x(B), (2 * (steps - 1)))], steps ≥ 2, Segment[(x(B), 0), (x(B), 2)]) → kSegment((x(A) - Distance, 0), (x(A) + Distance, 0)) → lRay((x(B), 0), (20, 0)) → mRay((x(A) - Distance, 0), (-20, 0)) → n
AI 绘图提示语参考
在坐标系中绘制绝对值不等式的解集区域,展示关键点与线段如何表示不等式的几何意义。首先画出一条横线段,再从关键点向两侧延伸线段,根据条件变化长度,最后添加两条射线表示无限延伸的区域,整体呈现绝对值不等式的解集形状。
以上提示语为根据原始绘图命令整理而来,仅供参考。