
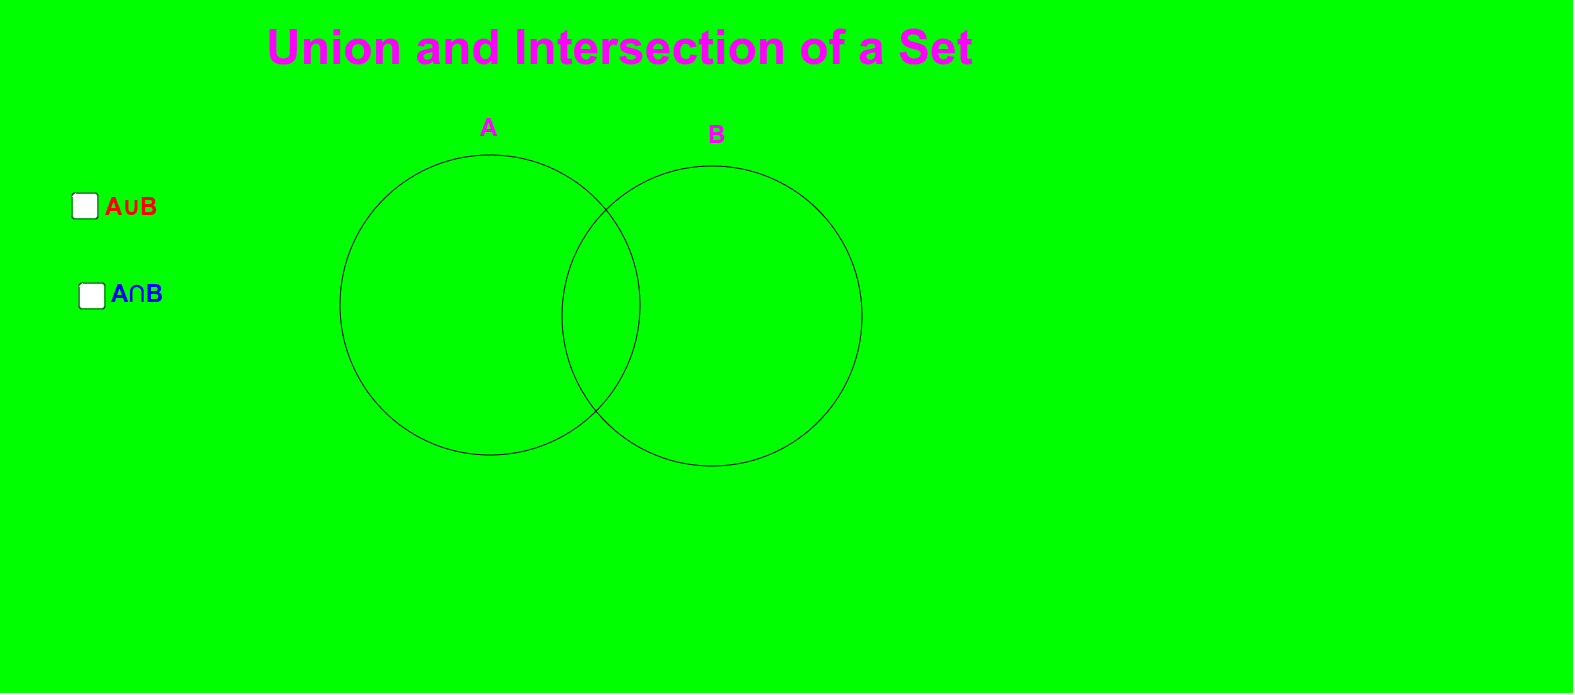
用维恩图演示集合的并集与交集
几何画板及绘图内容加载中,请稍等……
① This example uses a Venn diagram to visually demonstrate the union and intersection of two sets, with circular regions representing sets and highlighted overlapping or combined areas. ② The core mathematical concepts are set theory operations: union (∪) and intersection (∩), along with the relationships and region partitioning between sets. ③ Construction highlights: based on the construction summary, it uses GeoGebra commands such as Circle to create two circles (objects A and B), Intersect to find their intersection points (C and D), and CircleArc to draw arcs forming the Venn diagram boundaries; text objects (text1 to text5) label set names and operation results, with auxiliary segments (a, b) and special points (e, f, g, h) possibly aiding explanation. ④ Suitable for middle school (junior high or high school) introductory set theory, or college discrete mathematics, helping students intuitively grasp graphical representations of set operations.
GeoGebra 命令及参数
Circle(A, 3) → cCircle(B, 3) → dIntersect(c, d) → C, D, ,Circle(A, 3) → eCircle(B, 3) → fCircleArc(A, D, C) → gCircleArc(B, C, D) → h
AI 绘图提示语参考
绘制一个维恩图,展示两个集合的并集与交集。先画两个半径相同的圆,两圆相交,圆心分别代表两个集合。标出两圆的交点,并用弧线勾勒出两圆重叠的区域边界。在图形中,用不同颜色或阴影突出显示两圆重叠的部分(交集)以及两圆覆盖的全部区域(并集)。在圆内或旁边添加文字标签,分别标注两个集合的名称以及并集和交集的结果。可添加辅助线段或标记点,帮助说明集合运算的对应关系。整体构图清晰,适合教学演示。
以上提示语为根据原始绘图命令整理而来,仅供参考。