
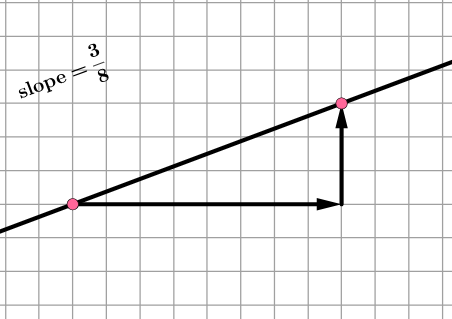
斜率演示
几何画板及绘图内容加载中,请稍等……
所属专题
A1.ACE.1 - Create and solve equations and inequalities
Expressing Geometric Properties with Equations (GPE) Cluster
Slope
Graphing Linear Equations
Graphing Linear Equations
Graphing Linear Equations
Graphing Linear Equations
该范例通过动态图形演示斜率的概念。核心数学概念包括斜率、坐标系和向量。使用了PointIn, Line, Point, If, Polygon, Vector, Slope等GeoGebra命令。适合初中及以上学生学习斜率和解析几何。
GeoGebra 命令及参数
PointIn(x ≥ x(A)) → BLine(A, B) → fPoint(Segment[A, B]) → CIf(y(B) ≥ y(A), (x(B), y(A)), (x(A), y(B))) → DPolygon(A, D, B) → t1, b, a, dVector(A, D) → uVector(D, B) → vIf(y(B) ≥ y(A), Midpoint[D, B], Midpoint[A, D]) → EIf(y(B) ≥ y(A), Midpoint[A, D], Midpoint[D, B]) → FSlope(Line[A, B]) → hNumerator(h) → iDenominator(h) → jIf(y(B) ≥ y(A), C + (j, 0), C + (0, i)) → GIf(y(B) ≥ y(A), G + (0, i), G + (j, 0)) → HPolygon(C, G, H) → t2, h_1, c_1, g_1Vector(C, G) → wVector(G, H) → kIf(y(B) ≥ y(A), Midpoint[C, G], Midpoint[G, H]) → IIf(y(B) ≥ y(A), Midpoint[G, H], Midpoint[G, C]) → JRotateText(text1, atand(Slope[f])) → text2RotateText(text5, atand(Slope[f])) → text3
AI 绘图提示语参考
绘制一个包含点A和点B的坐标系,点B在点A的右侧。通过点A和点B画一条直线f。在AB线段上取一点C。根据点A和B的坐标,构造一个平行四边形t1。绘制向量u和v,分别从A到D和从D到B。构造点E和F,它们是线段AD和DB的中点。计算直线AB的斜率h,并将其分解为分子i和分母j。根据斜率h,构造点G和H,它们分别位于直线AB的两侧。绘制向量w和k,分别从C到G和从G到H。构造点I和J,它们是线段CG和GH的中点。最后,旋转文本以显示斜率的角度。
以上提示语为根据原始绘图命令整理而来,仅供参考。