
温度随日出时数变化的散点图与一次函数拟合示例
几何画板及绘图内容加载中,请稍等……
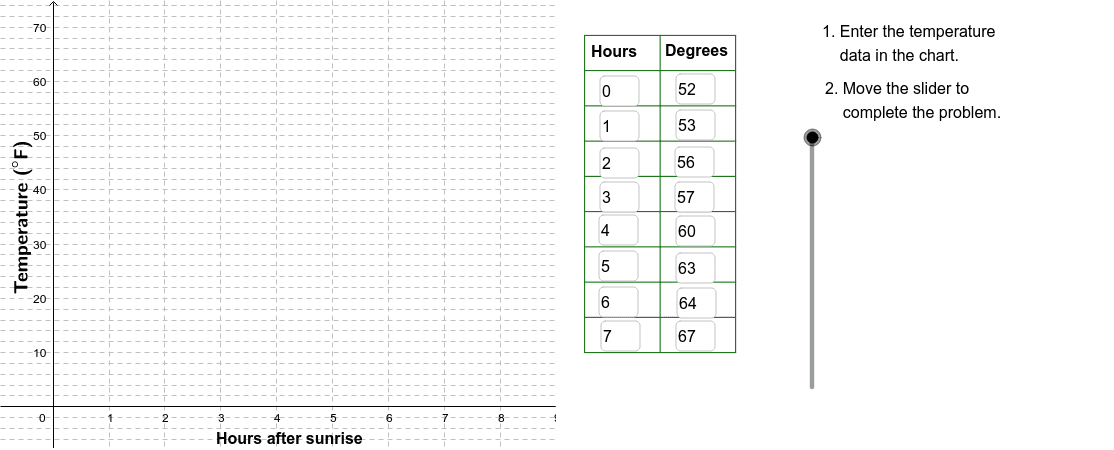
本范例通过记录五月某日日出后每小时的气温数据,绘制散点图并用一次函数进行线性拟合,直观展示时间与温度之间的线性关系。
涉及线性方程、一次函数、斜率与截距的含义,以及散点图的绘制与函数图像的叠加。
使用 GeoGebra 的 Corner、Polygon、Textfield、Sequence、Line、VerticalText 等命令,配合 Corn1~Corn4、Corn2、Corn3、Slid、poly1 等对象,构建坐标点序列、文本框以及交互滑块,实现动态演示。
适合中学七年级至十年级的函数概念教学、数据分析实验以及 GeoGebra 动态几何入门。
GeoGebra 命令及参数
Corner(2) → Corn2Corner(3) → Corn3Polygon(Corn1, Corn2, Corn3, Corn4) → poly1, corn1, corn2, corn3, corn4Textfield(A2) → InA2Textfield(A3) → InA3Textfield(A4) → InA4Textfield(A5) → InA5Textfield(A6) → InA6Textfield(A7) → InA7Textfield(A8) → InA8Textfield(A9) → InA9Textfield(B9) → InB9Textfield(B8) → InB8Textfield(B7) → InB7Textfield(B6) → InB6Textfield(B5) → InB5Textfield(B4) → InB4Textfield(B3) → InB3Textfield(B2) → InB2Sequence(Segment[(9.5, 10 + (6.5 * j)), (12.2, 10 + (6.5 * j))], j, 0, 9) → LnListSequence(Segment[(9.5 + (1.35 * j), 10), (9.5 + (1.35 * j), 68.5)], j, 0, 2) → LnList2Line(I, J) → FitLineVerticalText("\text{Temperature (}°\text{F)}") → DownLegend