
二次函数图像分析范例 by Walch Education
几何画板及绘图内容加载中,请稍等……
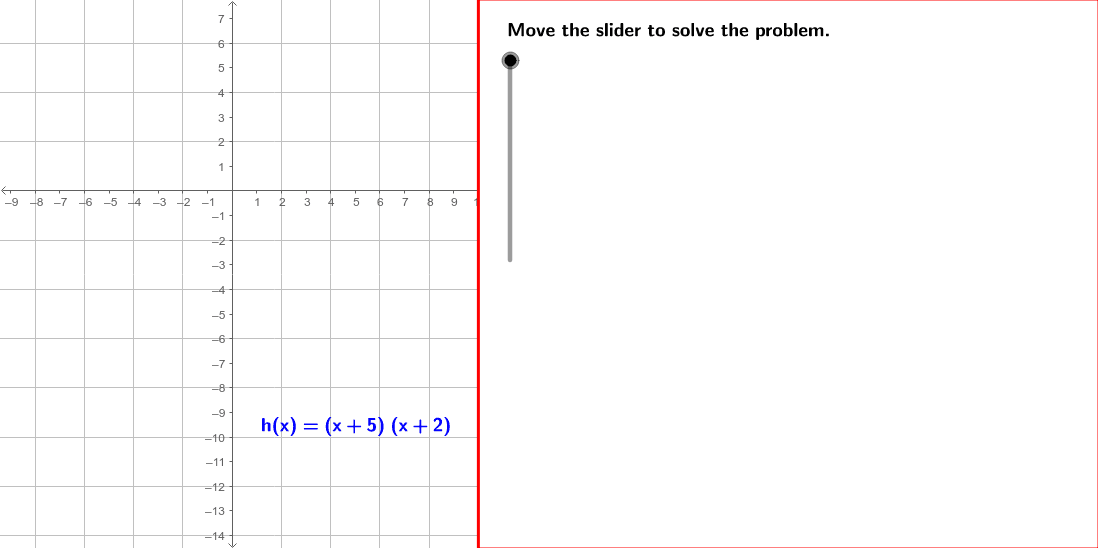
①本范例演示了如何通过 GeoGebra 绘制并分析二次函数 f(x) = (x + 5)(x + 2) 的图像;②涉及核心数学概念包括 x-截距、对称轴、顶点、因式分解、解析几何等;③作图要点提炼自构造摘要,使用了 If、Factors、Polygon、TableText 等命令和对象,如 root1、root2、SymLine 等;④适合高中数学教学,用于理解二次函数图像特征及计算几何属性。
GeoGebra 命令及参数
If(abs(a) ≟ 1, If[a ≟ 1, ha, (-ha(x))], h) → h1Factors(h) → factorshIf(abs(a) ≟ 1, If[a ≟ 1, "", "-"], LaTeX[a]) → a1If(abs(a_1) ≟ 1, If[a_1 ≟ 1, ha_1, (-ha_1(x))], h_1) → h1_1Factors(h_1) → factorsh_1Polygon((edge, y(Corner[1])), Corner[2], Corner[3], (edge, y(Corner[4]))) → Mask, b, c, d, eTableText({{"\textit{f}(\textit{x})=" + (LaTeX[h1]), "\text{Original equation}"}, {" 0=" + (LaTeX[h1]), "\text{Set the equation equal to 0}."}, {" 0=" + (LaTeX[factor1]) + "\text{ or }0=" + (LaTeX[factor2]), "\text{Set each factor equal to 0.}"}, {"\textcolor{Brown}{" + (LaTeX[root1]) + "}=x\text{ or }\textcolor{Brown}{" + (LaTeX[root2]) + "}=x", "\text{Solve each equation for }\textit{x}. "}}, "l") → Conclusion1TableText({{"\textit{f}(\textit{x})=" + (LaTeX[h1]), "\text{Original equation}"}, {"\textit{f}(" + (LaTeX[rootav]) + ")=" + (LaTeX[a1]) + "(" + (LaTeX[rootav]) + "" + (LaTeX[Element[plus, sgn((-root1)) + 2]]) + "" + (LaTeX[(-root1)]) + ") (" + (LaTeX[rootav]) + " " + (LaTeX[Element[plus, sgn((-root2)) + 2]]) + "" + (LaTeX[(-root2)]) + ")", "\text{Substitute }\textcolor{magenta}{ " + (LaTeX[rootav]) + "}\text{ for }\textit{x}."}, {"\textit{f}(" + (LaTeX[rootav]) + ")=" + (LaTeX[a1]) + "(" + (LaTeX[factor1(rootav)]) + ")(" + (LaTeX[factor2(rootav)]) + ")", "\text{Simplify.}"}}, "l") → Conclusion3b
AI 绘图提示语参考
画一个二次函数 f(x) = (x + 5)(x + 2) 的图像,标出 x 轴截距、对称轴、顶点,并展示因式分解过程和坐标几何关系。首先画出函数图像,然后标记 x 轴上的两个截距点,绘制对称轴,并标出顶点。接着,用文字说明因式分解步骤,展示如何将函数设为零并求解 x 轴截距,最后用文字解释如何代入顶点坐标验证函数值。
以上提示语为根据原始绘图命令整理而来,仅供参考。