
极坐标绘图器
几何画板及绘图内容加载中,请稍等……
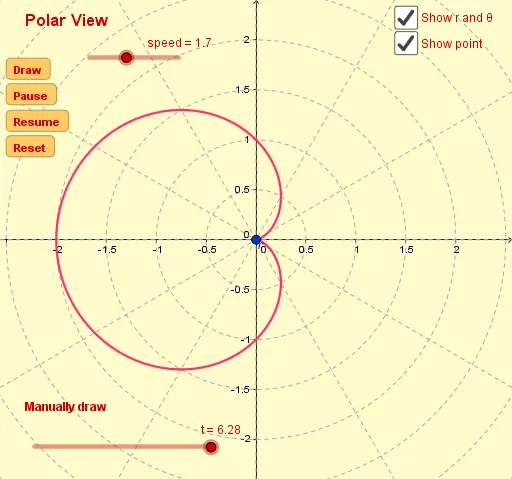
①本范例演示如何绘制极坐标方程的图形;②涉及的核心数学概念包括极坐标、三角函数、函数图像绘制;③作图要点:使用了Textfield, CurveCartesian, Segment, Intersect, CircleSector等GeoGebra命令和对象;④适合高中及以上学生学习和理解极坐标系统及函数图像。
GeoGebra 命令及参数
Textfield(f) → InputBoxFunctionTextfield(θmin) → InputBoxθminTextfield(θmax) → InputBoxθmaxCurveCartesian((f(θ) * cos(θ)), (f(θ) * sin(θ)), θ, θmin, t) → CurveSegment((0, 0), P) → segmentIntersect(segment, xAxis) → CCircleSector(C, B, A) → sector