
数轴上的点 by Walch Education
几何画板及绘图内容加载中,请稍等……
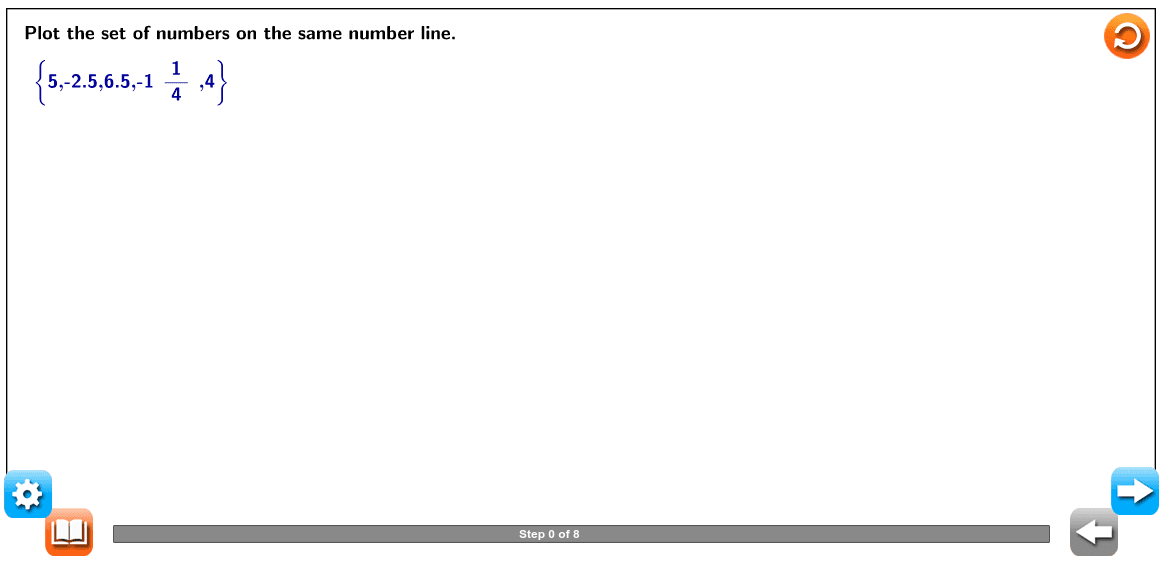
本示例展示了如何在数轴上绘制一组数。核心数学概念包括数轴、实数集和点的位置。使用了Point、Segment、Sort、Sequence等GeoGebra命令。适合初中及以上学生学习实数集的概念。
GeoGebra 命令及参数
Point(xAxis) → BPoint(xAxis) → CSegment(B, C) → aSegment((0, 0), (0, 1)) → iLaTeX("\text{Plot the set of numbers on the same number line.}") → Quest1LaTeX("\text{Identify the least and greatest number in the set of numbers.}") → Pg1ALaTeX("\text{Use the results to determine the scale.}") → Pg1ESort(list3) → AsortElement(Asort, 1) → sort1Element(Asort, 5) → sort2LaTeX((((((((((("\text{ \textcolor{#000099}{\left\{" * P1) * ",") * P2) * ",") * P3) * ",-") * CM) * ",") * P5) * "\right\}}")) → Question1BLaTeX("\text{line that are less than the least number and greater than the}") → Pg2GLaTeX("\text{greatest number.For this number line,include tick marks from}") → Pg2HSequence(Segment[A + (i, 0), A + (i, 0.5)], i, -3, 7) → list1Sequence(Segment[A + (i, 0), A + (i, (-0.5))], i, -3, 7) → list2LaTeX("\text{\textcolor{#000099}{–3} to \textcolor{#000099}{7}.Including these values,there are \textcolor{#000099}{11} integers between}") → Pg2ILaTeX("\text{\textcolor{#000099}{–3} and \textcolor{#000099}{7}.Place \textcolor{#000099}{11} tick marks on the number line and label from}") → Pg2JLaTeX("\text{\textcolor{#000099}{–3} to \textcolor{#000099}{7},with enough space in between to allow for marking the “half”}") → Pg2KLaTeX("\text{and “quarter” values in the set.Note that,in this case,labeling the tick}") → Pg2LLaTeX("\text{marks in increments of \textcolor{#000099}{0.5} or \textcolor{#000099}{0.25} instead of \textcolor{#000099}{1} would make the number}") → Pg2MLaTeX("\text{line harder to read.}") → Pg2NLaTeX("\text{Plot each point.}") → Pg3ALaTeX("\text{Place a point at the location of each number.}") → Pg3BLaTeX((((((((((("\text{The values given are \textcolor{#000099}{" * P1) * ",") * P2) * ",") * P3) * ",-") * CM) * "\;and\;") * P5) * "}.}")) → Pg3CLaTeX((((("\text{Plot the points at the whole-number values \textcolor{#000099}{" * P1) * "} and \textcolor{#000099}{") * P5) * "}.The three}")) → Pg3DLaTeX("\text{remaining values are either decimals or fractions,so use estimation}") → Pg3ELaTeX("\text{to plot them between the tick marks on the number line.Estimate}") → Pg3FLaTeX((((((((((("\text{halfway between\textcolor{#000099}{" * CP2) * "} and\textcolor{#000099}{") * FP2) * "} for \textcolor{#000099}{") * P2) * "},halfway between \textcolor{#000099}{") * FP3) * "} and \textcolor{#000099}{") * CP3) * "}}")) → Pg3GIf(P4 ≟ 2, LaTeX[(((((((((("\text{ \textcolor{#000099}{\left\{" * P1) * ",") * P2) * ",") * P3) * ",-") * 2) * ",") * P5) * "\right\}}")], LaTeX[(((((((((("\text{ \textcolor{#000099}{\left\{" * P1) * ",") * P2) * ",") * P3) * ",-") * CM) * ",") * P5) * "\right\}}")]) → IF1If(P4 ≠ 2, LaTeX[(((("\text{(Recall that\textcolor{#000099}{-" * CM) * "} is equal to \textcolor{#000099}{–") * P4) * "}.)}")]) → Pg3IIf(P4 ≠ 2, LaTeX[(((("\text{Plot the points at the whole-number values \textcolor{#000099}{" * P1) * "} and \textcolor{#000099}{") * P5) * "}.The three}")], LaTeX[(((("\text{Plot the points at the whole-number values \textcolor{#000099}{" * P1) * "},\textcolor{#000099}{") * P5) * "} and\textcolor{#000099}{-2}.The two}")]) → Ifpg3DIf(P4 ≟ 1.25, LaTeX[(((((((("\text{for \textcolor{#000099}{" * P3) * "},and one-fourth of the way between \textcolor{#000099}{–") * FP4) * "} and \textcolor{#000099}{–") * CP4) * "} for\textcolor{#000099}{- ") * CM) * "}.}")]) → Pg3HIfIf(P4 ≟ 1.5, LaTeX[(((((((("\text{for \textcolor{#000099}{" * P3) * "},and half of the way between \textcolor{#000099}{–") * FP4) * "} and \textcolor{#000099}{–") * CP4) * "} for\textcolor{#000099}{- ") * CM) * "}.}")]) → Pg3H1f2If(P4 ≟ 1.75, LaTeX[(((((((("\text{for \textcolor{#000099}{" * P3) * "},and three-fourth of the way between \textcolor{#000099}{–") * FP4) * "} and \textcolor{#000099}{–") * CP4) * "} for\textcolor{#000099}{- ") * CM) * "}.}")]) → Pg3Hif3If(P4 ≟ 2, LaTeX[(("\text{for \textcolor{#000099}{" * P3) * "}.}")]) → Pg3HIf4If(P4 ≟ 2.25, LaTeX[(((((((("\text{for \textcolor{#000099}{" * P3) * "},and one-fourth of the way between \textcolor{#000099}{–") * CP4) * "} and \textcolor{#000099}{–") * FP4) * "} for\textcolor{#000099}{- ") * CM) * "}.}")]) → Pg3Hif5If(P4 ≟ 2.5, LaTeX[(((((((("\text{for \textcolor{#000099}{" * P3) * "},and half of the way between \textcolor{#000099}{–") * CP4) * "} and \textcolor{#000099}{–") * FP4) * "} for\textcolor{#000099}{- ") * CM) * "}.}")]) → Pg3Hif6LaTeX("\text{\mathbf{Domain} the set of all input values (\textcolor{#000099}{x}-values) that satisfy the given function}") → WTk1LaTeX("\text{without restriction.}") → WTK2If(P4 ≟ 2 ∧ (P2 ≟ (-2.5) ∨ P2 ≟ (-3.5)), LaTeX[(((("\text{The least number is\textcolor{#000099}{" * sort1) * "} and the greatest number is \textcolor{#000099}{") * sort2) * "}.Therefore,}")], LaTeX[(((("\text{The least number is\textcolor{#000099}{" * sort1) * "} and the greatest number is \textcolor{#000099}{") * sort2) * "}.Therefore,}")]) → Pg1BIf(P4 ≟ 2 ∧ (P2 ≟ (-2.5) ∨ P2 ≟ (-3.5)), LaTeX[(((("\text{The data ranges from\textcolor{#000099}{" * sort1) * "} to \textcolor{#000099}{") * sort2) * "}.Include numbers on the number}")], LaTeX[(((("\text{The data ranges from\textcolor{#000099}{" * sort1) * "} to \textcolor{#000099}{") * sort2) * "}.Include numbers on the number}")]) → Pg2FIf(P4 ≟ 2 ∧ (P2 ≟ (-2.5) ∨ P2 ≟ (-3.5)), LaTeX[(((("\text{the number line must include numbers ranging from\textcolor{#000099}{" * sort1) * "} to \textcolor{#000099}{") * sort2) * "}.}")], LaTeX[(((("\text{the number line must include numbers ranging from\textcolor{#000099}{" * sort1) * "} to \textcolor{#000099}{") * sort2) * "}.}")]) → Pg1CIf(P4 ≟ 2, LaTeX[(((((((((("\text{The values given are \textcolor{#000099}{" * P1) * ",") * P2) * ",") * P3) * ",-") * 2) * "},and \textcolor{#000099}{") * P5) * "}.}")], LaTeX[(((((((((("\text{The values given are \textcolor{#000099}{" * P1) * ",") * P2) * ",") * P3) * ",-") * CM) * "},and \textcolor{#000099}{") * P5) * "}.}")]) → IfPg3c