
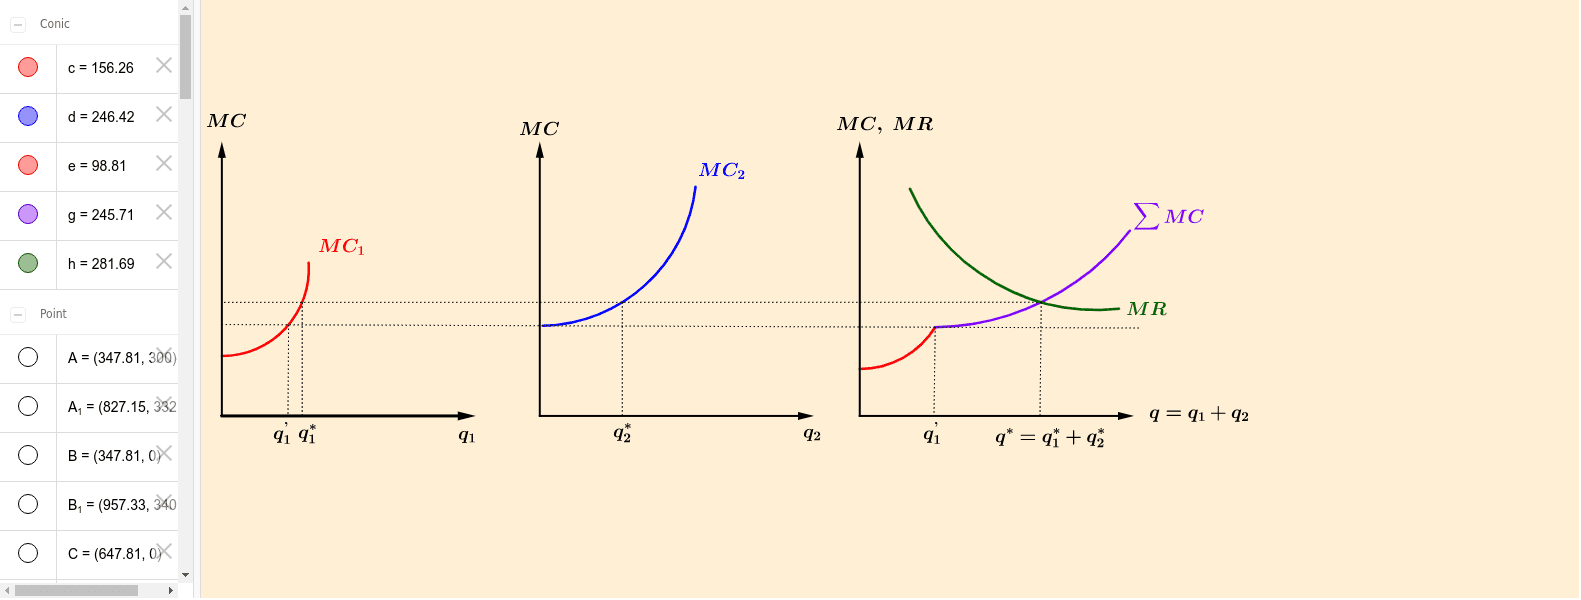
植物间产量分配图
几何画板及绘图内容加载中,请稍等……
该范例展示了不同植物间产量的分配情况。涉及的核心数学概念包括函数和向量。通过使用GeoGebra命令如Point、Vector、Segment等,可以构造出直观的产量分配图。适合高中数学教学,特别是函数图像和几何作图的教学。
GeoGebra 命令及参数
Point(yAxis) → GPoint(xAxis) → HVector(G, H) → axis5Point(axis5) → IPoint(yAxis) → JVector(I, J) → axis6Vector(B, A) → axis7Vector(B, C) → axis2Vector(E, D) → axis3Vector(E, F) → axis4Point(axis6) → KSegment(K, N) → fPoint(axis6) → LPoint(axis6) → OCircleArc(L, O, P) → cPoint(axis7) → QPoint(f) → RCircleArc(Q, R, S) → dPoint(axis3) → TPoint(axis3) → UCircleArc(T, U, V) → eIntersect(e, f, 1) → WCircleArc(Z, W, A_1) → gCircleArc(B_1, C_1, D_1) → hIntersect(g, h, 1) → E_1Point(axis6) → F_1Segment(E_1, F_1) → iIntersect(c, f, 1) → G_1Point(axis5) → H_1Segment(G_1, H_1) → jIntersect(c, i, 1) → I_1Point(axis5) → J_1Segment(I_1, J_1) → kIntersect(d, i, 1) → K_1Point(axis2) → L_1Segment(K_1, L_1) → lIntersect(e, g, 1) → M_1Point(axis4) → N_1Segment(M_1, N_1) → mIntersect(g, h, 1) → O_1Point(axis4) → P_1Segment(O_1, P_1) → n
AI 绘图提示语参考
绘制一个坐标系,其中轴线轴5和轴6分别与y轴和x轴平行。在轴5上依次放置点I、K、L、O,并通过这些点绘制弧线c、d、e、g、h。在轴6上放置点J、N、R,通过这些点绘制弧线f。通过点I、K、L、O、J、N、R绘制直线段i、j、k、l、m、n,这些直线段与弧线相交形成多个交点,如W、G_1、H_1、I_1、J_1、K_1、L_1、M_1、O_1、P_1、Q_1、R_1、S_1、T_1、U_1、V_1、W_1、X_1、Y_1、Z_1。
以上提示语为根据原始绘图命令整理而来,仅供参考。